Better Volume Classifications
 By LuxAlgoJun 11, 2026
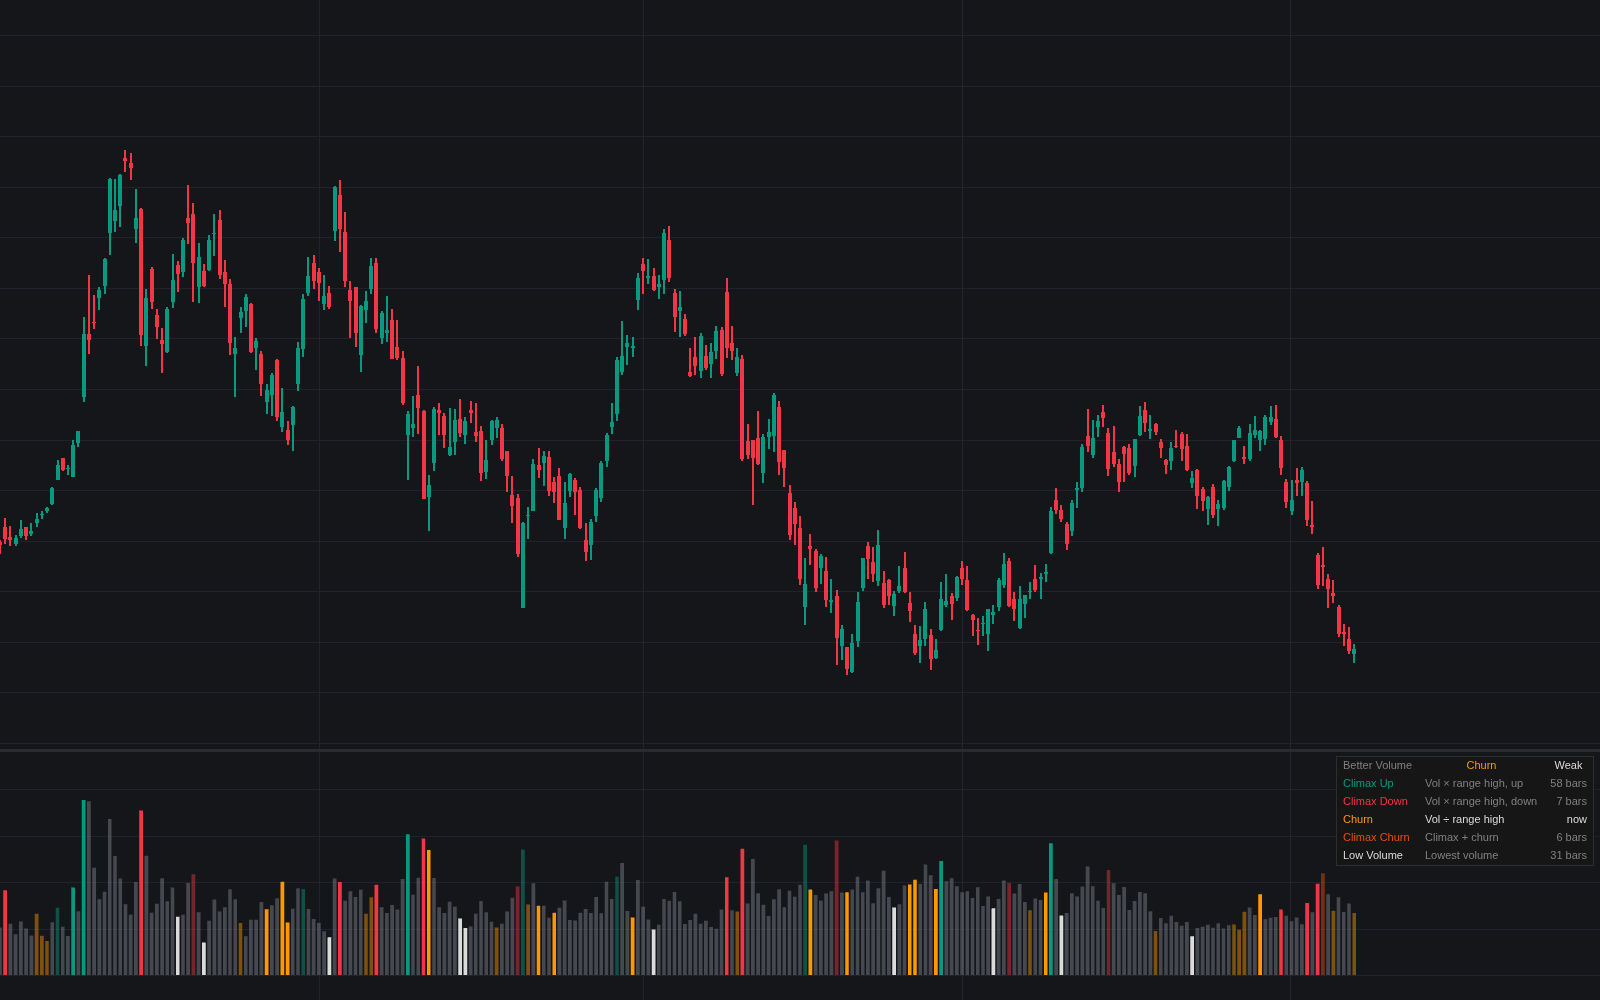

Better Volume Classifications is the definitive clean take on Better Volume classifications: the volume histogram is repainted by rule, each bar benchmarked against rolling extremes across three series (raw volume, volume × range, and volume ÷ range), so every label is relative to the instrument's current behavior rather than a fixed threshold. A second, shorter window grades weak prints in a lighter shade, and a dashboard legend shows each classification's rule and how long since it printed.
How to Trade the Better Volume Classifications?
- Climax Up / Climax Down: extreme volume × range catches a final rush of aggressive buyers or sellers. After an extended move it is an exhaustion alert; wait for failed follow-through or a quiet test rather than fading the bar.
- Churn: heavy volume that bought almost no range. Absorption when it prints at an extreme, two-sided noise mid-range; the next few bars name the winner.
- Climax Churn: both extremes at once, the scheme's strongest absorption warning, especially when repeated into the same zone.
- Low Volume: the window's quietest bar, the classic test print that supports continuation on a pullback or strengthens an exhaustion read after a climax.
Better Volume Classifications Settings
- Lookback (default 20): window each print is benchmarked against; longer keeps labels for rare prints, shorter flags more bars at the cost of noise.
- Grade Weak Prints (default on): grades full-lookback extremes strong and shorter-window extremes weak.
- Weak Print Lookback (default 10): length of that shorter window, clamped to the main lookback.
- Show Dashboard (default on) with position and size options.
- Color Price Bars By Classification (default off): additionally paints the price bars that receive a label.
Frequently Asked Questions

Original indicatorBuilt in-house by LuxAlgo
The Library is free. Quant makes it yours.
Pull any concept or indicator into Quant: rebuild it, retune it, or turn it into a backtested strategy of your own.