Concept
Better Volume Classifications
Better Volume Classifications, also known as Hawkeye volume, are Volume & Order Flow concepts. The Library holds 1 implementation, a working definition you can pull into Quant.
Top Better Volume Classifications indicator
The top custom implementation, built on the original standard Better Volume Classifications formula.
1 total
From studying Better Volume Classifications to trading it: take the implementation below into Quant and backtest it instantly.
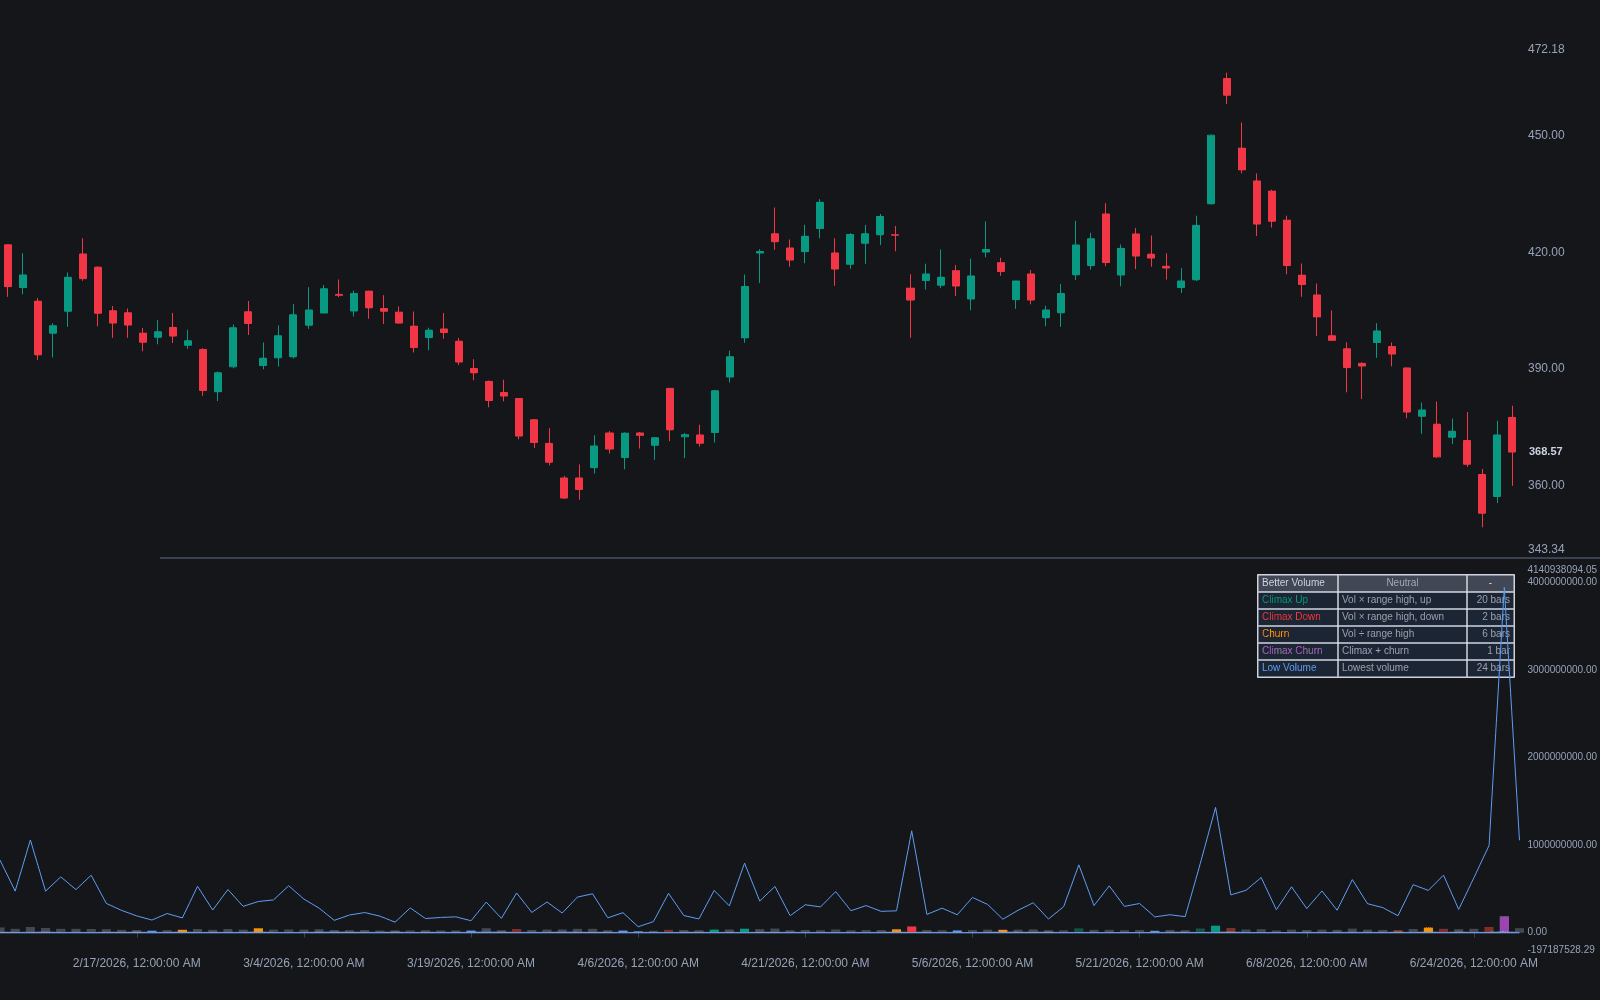
What are Better Volume Classifications?
Better Volume classifications are a bar-labeling scheme that sorts each bar into a volume archetype using three inputs: volume, the bar's range (spread), and the close. Typical categories are climax up and climax down (extreme volume paired with a wide range, on up bars and down bars respectively), churn (extreme volume trapped in a narrow range), climax churn (both at once), and low volume (activity drying up). Labels come from comparing each bar's raw volume, its volume times range, and its volume divided by range against rolling extremes over a lookback window, so every classification is relative to the instrument's own recent behavior.
The best-known implementation is the Better Volume indicator, published free by trader Barry Taylor of the Emini-Watch site, and the same paint-the-volume idea circulates commercially as Hawkeye volume, which LazyBear's popular TradingView port approximates. The roots are older: Richard Wyckoff's effort-versus-result principle and Tom Williams' Volume Spread Analysis both judge volume by the range it produced, and Better Volume turns that judgment into mechanical labels. Similar systems trade under several names; the categories, not the branding, are the concept.
Each label compresses one effort-versus-result verdict. Climax bars flag potential exhaustion after extended moves, marking the point where the last aggressive buyers or sellers commit at once. Churn flags effort that produced no progress, heavy volume trapped in a narrow range, which often reflects absorption near highs or lows. Low-volume bars mark tests and disinterest, kin to VSA's no-demand and no-supply bars.
The scheme's value is normalization. A raw volume spike says only that activity was large; classifying it against range says what that activity accomplished, and benchmarking against rolling extremes keeps the labels portable across instruments and timeframes without fixed thresholds. Like relative volume, the labels ask whether behavior is unusual for this market; unlike it, they also ask whether the effort moved price.
How to identify Better Volume classifications on a chart
Most traders apply an indicator that paints the volume histogram, but the labels can be checked by hand:
- 1Set a lookback window (20 bars is a common default, and Taylor's own versions add a second, shorter window so strong and weak extremes are graded separately) and track three series: each bar's raw volume, its volume times range, and its volume divided by range.
- 2Label climax up when an up bar's volume-times-range sets a window high; the same print on a down bar is climax down.
- 3Label churn when volume divided by range sets a window high, meaning heavy trade bought almost no movement; a bar qualifying as climax and churn at once prints climax churn.
- 4Label low volume when the bar's raw volume is the lowest of the window, the classic quiet test bar.
- 5Read every label by location: a climax after a long advance, churn at a swing high, or a low-volume pullback into support each mean something different from the same print in the middle of a range.
How traders use it
- Reversal watch: a climax label after an extended trend is an exhaustion alert, and standard practice is to wait for confirmation, such as failed follow-through or a low-volume test that holds, rather than fading the climax bar itself.
- Absorption detection: churn near highs or lows suggests one side is quietly absorbing the other's aggression, in the spirit of stopping volume, with the winner judged by what price does over the next few bars.
- Trend health: low-volume labels on pullbacks support continuation, while repeated climax and churn prints into the same zone warn that a move is being capped.
- Breakout validation: a climax up bar clearing a range boundary shows the participation breakouts need, the same question asked by volume at breakout, while churn at the boundary warns the push is being absorbed.
- Location pairing: labels matter most at pre-marked levels, so many traders read them against a volume profile, watching how climax or churn bars behave at the point of control or the edges of the value area.
Better Volume Classifications vs. related concepts
Volume Spike: A volume spike flags magnitude alone, any bar far above its average. Better Volume classifications add the range dimension, separating a spike that drove price (climax) from one that went nowhere (churn).
Relative Volume: Relative volume normalizes activity against the same time of day to say how unusual participation is. It carries no verdict on what the volume achieved, which is exactly the judgment the classifications encode.
OBV: OBV accumulates volume by close direction into one cumulative line rather than labeling bars. Better Volume answers what this bar was; OBV tracks where the pressure has been flowing over time.
Concept family
Volume & Order Flow
88 concepts mapped · 88 in the Library
Better Volume Classifications FAQ
Turn Better Volume Classifications into a trading strategy.
Take the implementation from this page into Quant, then build on it, backtest it on real data, and keep refining it in conversation.