Bill Williams Market Facilitation Index
 By LuxAlgoApr 12, 2026
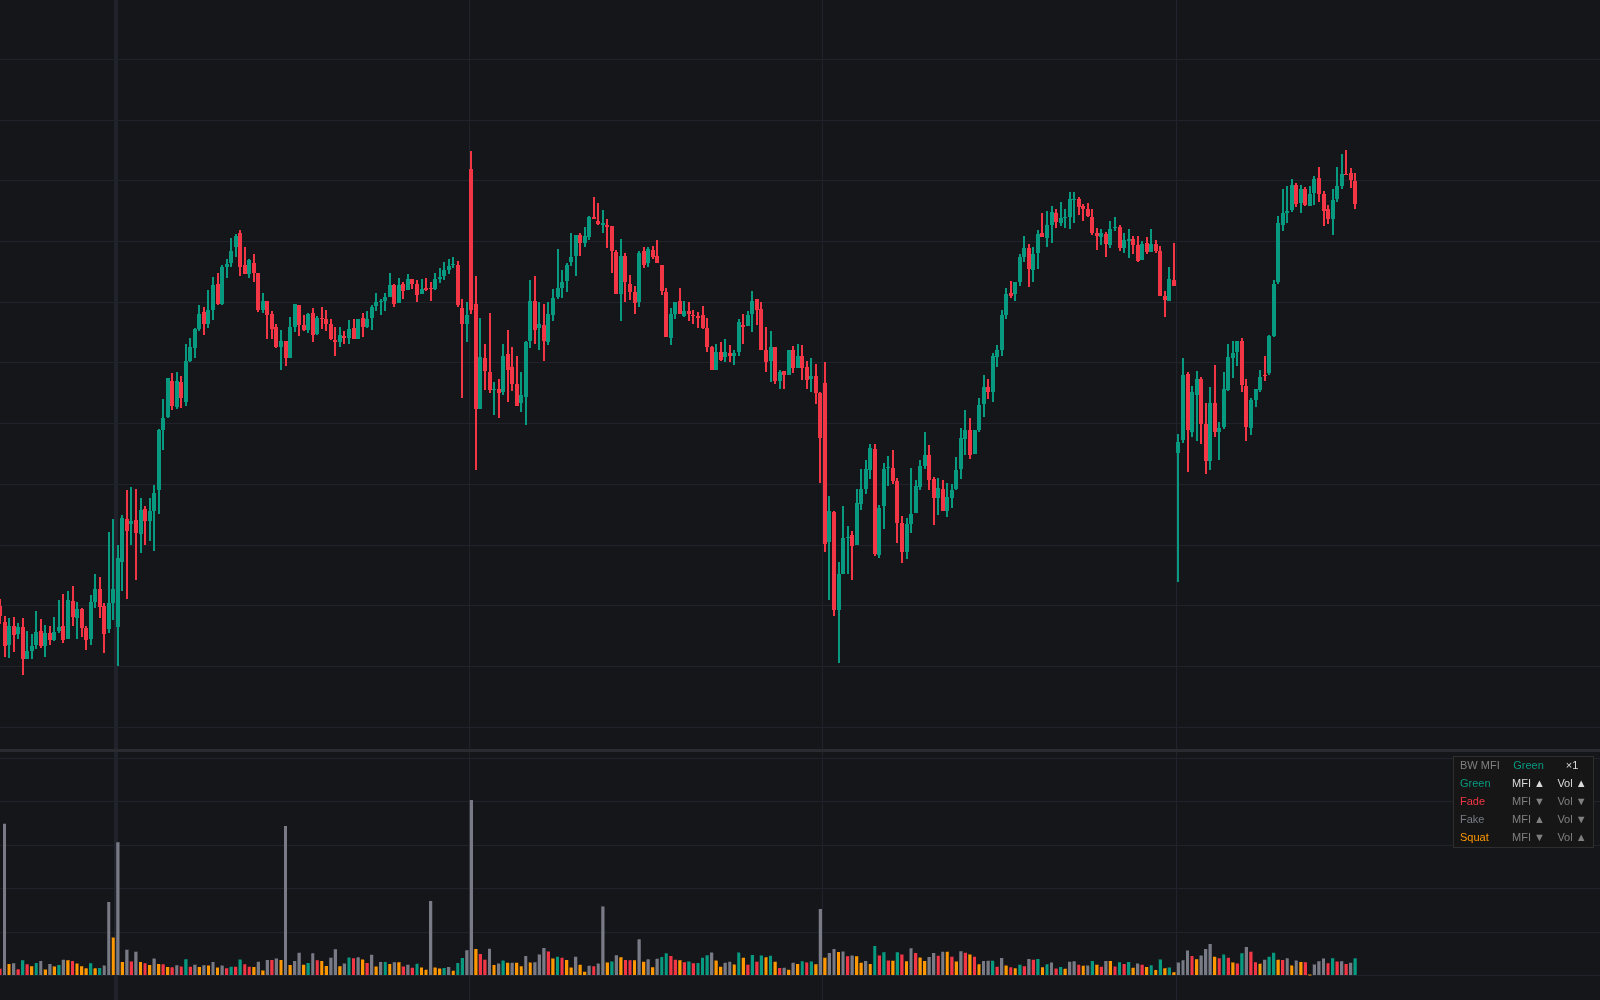

Bill Williams Market Facilitation Index is the definitive clean build of the Bill Williams Market Facilitation Index: each column is the bar's range divided by its volume, colored by pairing the index's bar-to-bar direction with volume's. Green (both up), fade (both down), fake (index up, volume down), and squat (index down, volume up). Because the raw number carries no fixed scale, only that change is read, and the dashboard legend keeps the four rules, the current state, and its streak in view.
How to Trade the Bill Williams Market Facilitation Index?
- Green strings: each unit of rising volume is buying more range, a participated move; a run of the configured length fires the Green Streak alert.
- Fade strings: interest draining away as participation thins. Mind scheduled session lulls.
- Fake bars: range expanding on shrinking volume, movement without backing that tends to be given back once the unsupported push stalls.
- Squat bars: heavy trade buying little range, a standoff that tends to precede turning points and breakout attempts while carrying no direction of its own.
Bill Williams Market Facilitation Index Settings
- Streak Length (default 3): consecutive same-state bars that count as a string and drive the streak alerts.
- Mark Squat Bars On Price (default off): draws a small square above price bars printing a squat.
- Color Price Bars By State (default off): paints price bars with the state palette so the reads can be followed on the chart itself.
- Show Dashboard (default on): legend placement and text size.
- Colors: one input per state (green, fade, fake, squat) plus unclassified bars.
Frequently Asked Questions

Original indicatorBuilt in-house by LuxAlgo
The Library is free. Quant makes it yours.
Pull any concept or indicator into Quant: rebuild it, retune it, or turn it into a backtested strategy of your own.