Concept
Bill Williams Market Facilitation Index
Bill Williams Market Facilitation Index is a Volume & Order Flow concept. The Library holds 1 implementation, a working definition you can pull into Quant.
BW MFI
Top Bill Williams Market Facilitation Index indicator
The top custom implementation, built on the original standard Bill Williams Market Facilitation Index formula.
1 total
Want to trade Bill Williams Market Facilitation Index? The implementation below is one prompt away from a backtested strategy in Quant.
What is the Bill Williams Market Facilitation Index?
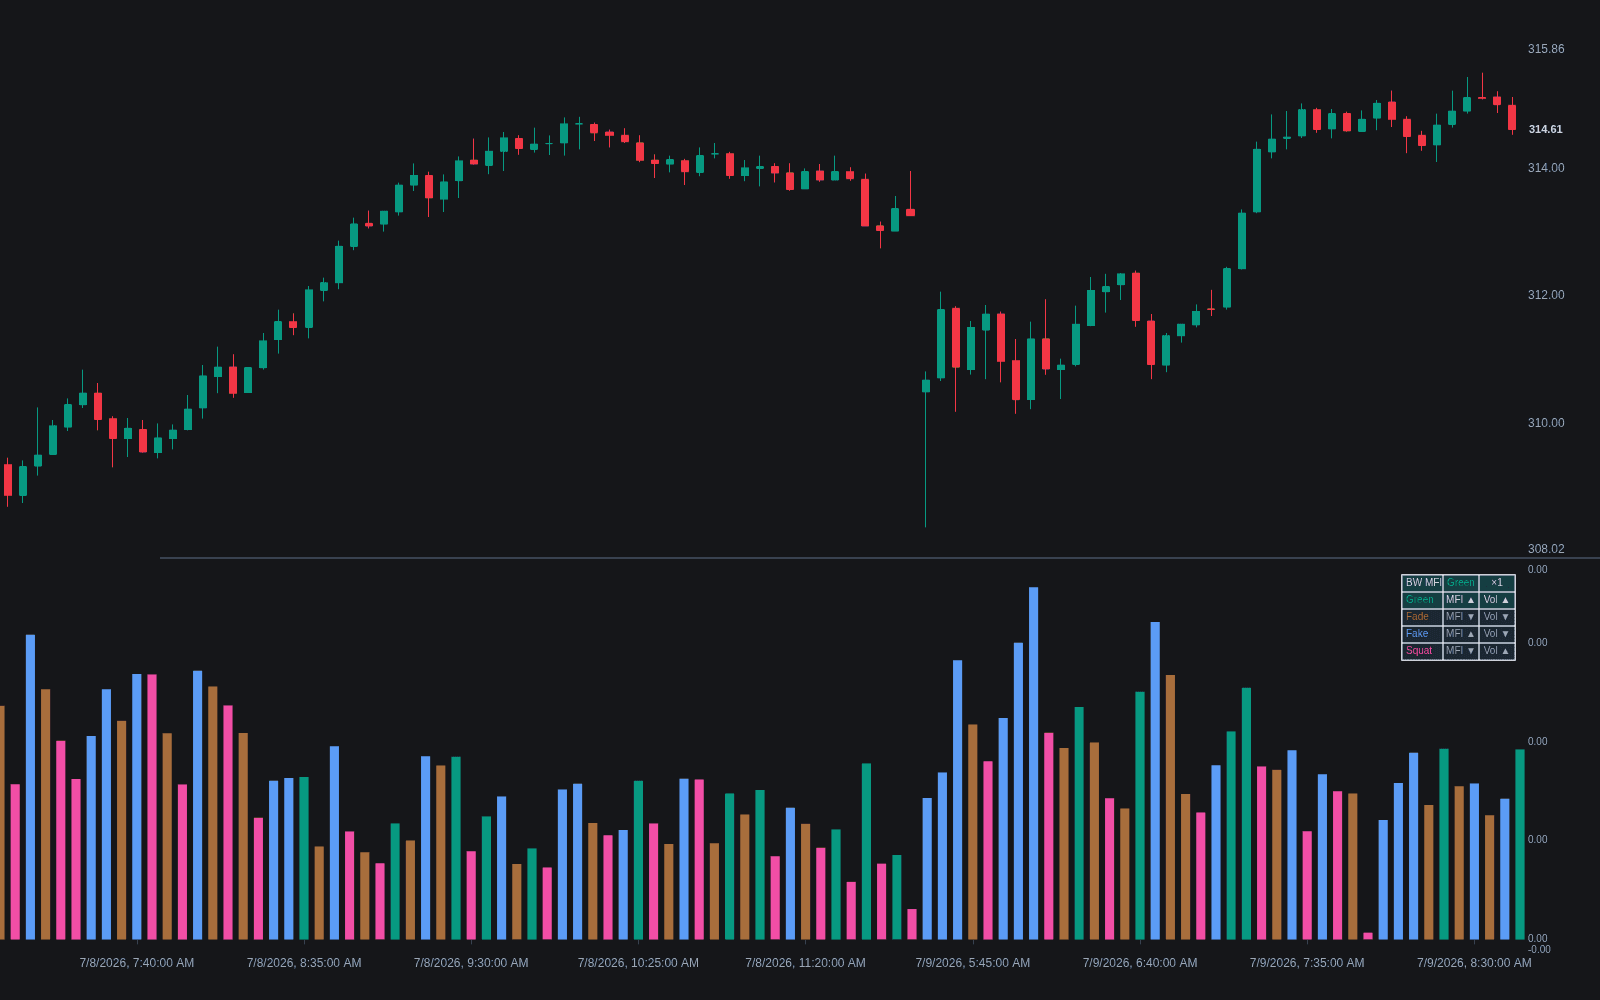
The Bill Williams Market Facilitation Index (BW MFI) measures how much price movement each unit of volume produced: the bar's high minus its low, divided by its volume. Williams introduced it in Trading Chaos as a gauge of how efficiently the market is facilitating trade. Rising values mean each unit of volume is moving price further; falling values mean volume is buying less range. It shares an acronym with, but is otherwise unrelated to, the Money Flow Index.
Williams, the trader and author who also created the Alligator, the Awesome Oscillator, and his fractal levels, built the index for the Trading Chaos framework he published in the mid-1990s. His premise was that markets exist to facilitate trade, so the interesting question is not how much volume printed but how much movement that volume bought. The raw value is scale-dependent, tied to an instrument's tick size and typical volume, so it cannot be compared across markets; only its bar-to-bar change matters.
The index is read jointly with volume, giving four bar states: MFI up with volume up ('green', a participated move), both down ('fade', a dying market), MFI up with volume down ('fake', movement without backing), and MFI down with volume up ('squat', heavy volume producing little range). MetaTrader's standard implementation paints these green, brown, blue and pink, which is why the states are often called by color.
The squat draws the most attention: it is effort without result, a battle at one price that Williams argued often appears near turns and breakout points, without itself saying which way things resolve. In that sense BW MFI compresses Wyckoff-style volume reading into a single per-bar ratio, a mechanical cousin of tools like volume divergence that compare participation against progress.
How to identify BW MFI bar states on a chart
The index ships with most platforms as a color-coded histogram; classifying a bar takes two comparisons:
- 1Compute or display (high minus low) divided by volume for each bar; ignore the absolute number and track whether it rose or fell from the prior bar.
- 2Check whether volume rose or fell over the same bar; the two directions combine into one of the four states: green, fade, fake or squat.
- 3Scan for squats after an extended leg or at a level you already care about, such as a prior point of control or a range boundary; a squat in dead mid-range means far less.
- 4Treat strings of the same state as the message, not single prints: consecutive green bars describe a facilitated trend, repeated fades a market losing its audience.
- 5Confirm with price structure on the following bars, since no state carries direction on its own.
How it's calculated
BW MFI measures how much price range each unit of volume produced on a bar.
Defined by Bill Williams in Trading Chaos; it is unrelated to the volume-weighted Money Flow Index despite the shared MFI abbreviation.
The raw value depends on the instrument's price scale and volume units, so only the bar-to-bar comparison is read; some platforms multiply it by a fixed constant for display.
The four states above are Williams' green, fade, fake and squat windows, usually drawn as bar or histogram colors.
How traders use it
- Classifying bars during a move: strings of green bars support continuation, while a squat after an extended leg warns that the move is meeting genuine opposition.
- Fading unsupported pushes: a fake bar, range expanding while volume shrinks, suggests the move lacks participation and is vulnerable to retracing.
- As context inside Williams' framework: he read BW MFI alongside his Alligator and fractals rather than as a standalone trigger, and most modern uses keep it as a filter, not a signal.
- Judging breakouts: green bars through a boundary show the move is being facilitated, the same question asked by volume at breakout, while a squat right at the boundary warns the push is meeting a wall of opposing orders.
- Separating fades from session lulls: because volume ebbs on a schedule, some traders sanity-check fade states against relative volume to avoid reading an ordinary lunchtime lull as a dying trend.
BW Market Facilitation Index vs. related volume tools
Money Flow Index: The Money Flow Index is a 0-100 oscillator of volume-weighted typical price, read for overbought and oversold conditions. BW MFI has no fixed scale and grades range earned per unit of volume; the shared acronym is the only overlap.
OBV: OBV accumulates volume by close direction to track cumulative pressure over time. BW MFI ignores direction entirely and grades each bar's efficiency, so the two answer different questions and are sometimes read together.
Volume Delta: Volume delta splits a bar's volume by aggressor to show who was pressing; BW MFI compares total volume against range to show what the pressing achieved. A squat with heavy one-sided delta is a sharper absorption read than either alone.
Concept family
Volume & Order Flow
88 concepts mapped · 88 in the Library
Bill Williams Market Facilitation Index FAQ
Turn Bill Williams Market Facilitation Index into a trading strategy.
Take the implementation from this page into Quant, then build on it, backtest it on real data, and keep refining it in conversation.