Cause & Effect
 By LuxAlgoJul 26, 2026
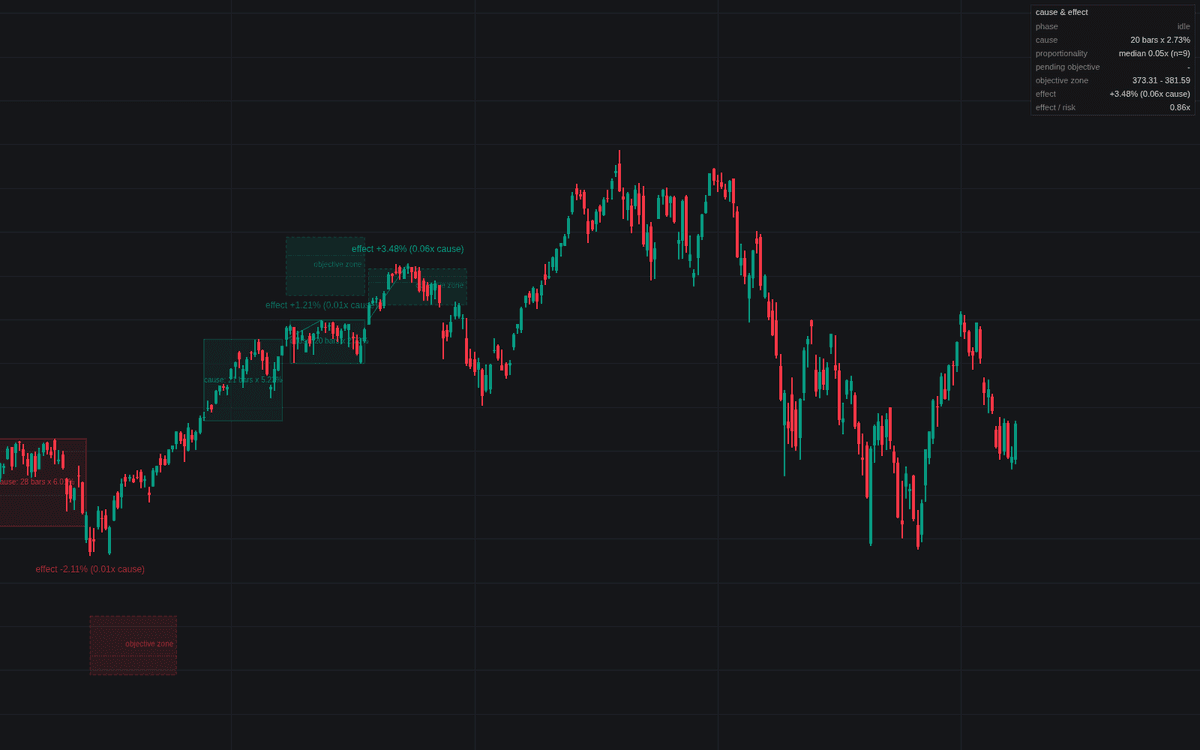

Cause & Effect puts Wyckoff's law of cause and effect on the chart as a working instrument. A consolidation of 20+ bars inside a volatility-capped window is marked as the cause; a close beyond the range tints the box with the breakout direction and projects an objective zone from the cause's size and the effect/cause ratios observed on the chart. Completed episodes feed the calibration, so projections are the chart's own measured tendency.
How to Trade the Cause & Effect?
- Neutral cause box: preparation is building; dotted pending objectives creep away from both sides as it grows.
- Upward or downward resolution: markup or markdown begins; the shaded zone spans the interquartile band of realized ratios around the dotted median.
- Effect label: tracks the farthest excursion and its multiple of the cause; the dashboard's effect/risk row sizes it against a stop across the range.
Alerts cover cause formation, both breakouts, the zone reached or exceeded, and the episode's end.
Cause & Effect Settings
- Minimum Cause Duration (Bars) (default 20): fewest bars inside the capped window to qualify.
- Maximum Cause Height (xATR) (default 3.5): range height cap, in volatility-baseline multiples.
- Volatility Baseline Length (default 200): ATR length behind the height cap.
- Cause Size Measure (default Duration x Height): duration x height, duration x ATR, or height alone.
- Calibration Memory (Episodes) (default 20): episodes used to estimate the proportionality.
- Show Dashboard (default enabled) with Dashboard Position (default Top Right).
- Style toggles (Cause Ranges, Pending Objectives While Cause Builds, Objective Zone, Effect Path, Cause / Effect Labels, Keep Completed Episodes) are on by default.
Frequently Asked Questions

Original indicatorBuilt in-house by LuxAlgo
The Library is free. Quant makes it yours.
Pull any concept or indicator into Quant: rebuild it, retune it, or turn it into a backtested strategy of your own.