Concept
Cause & Effect
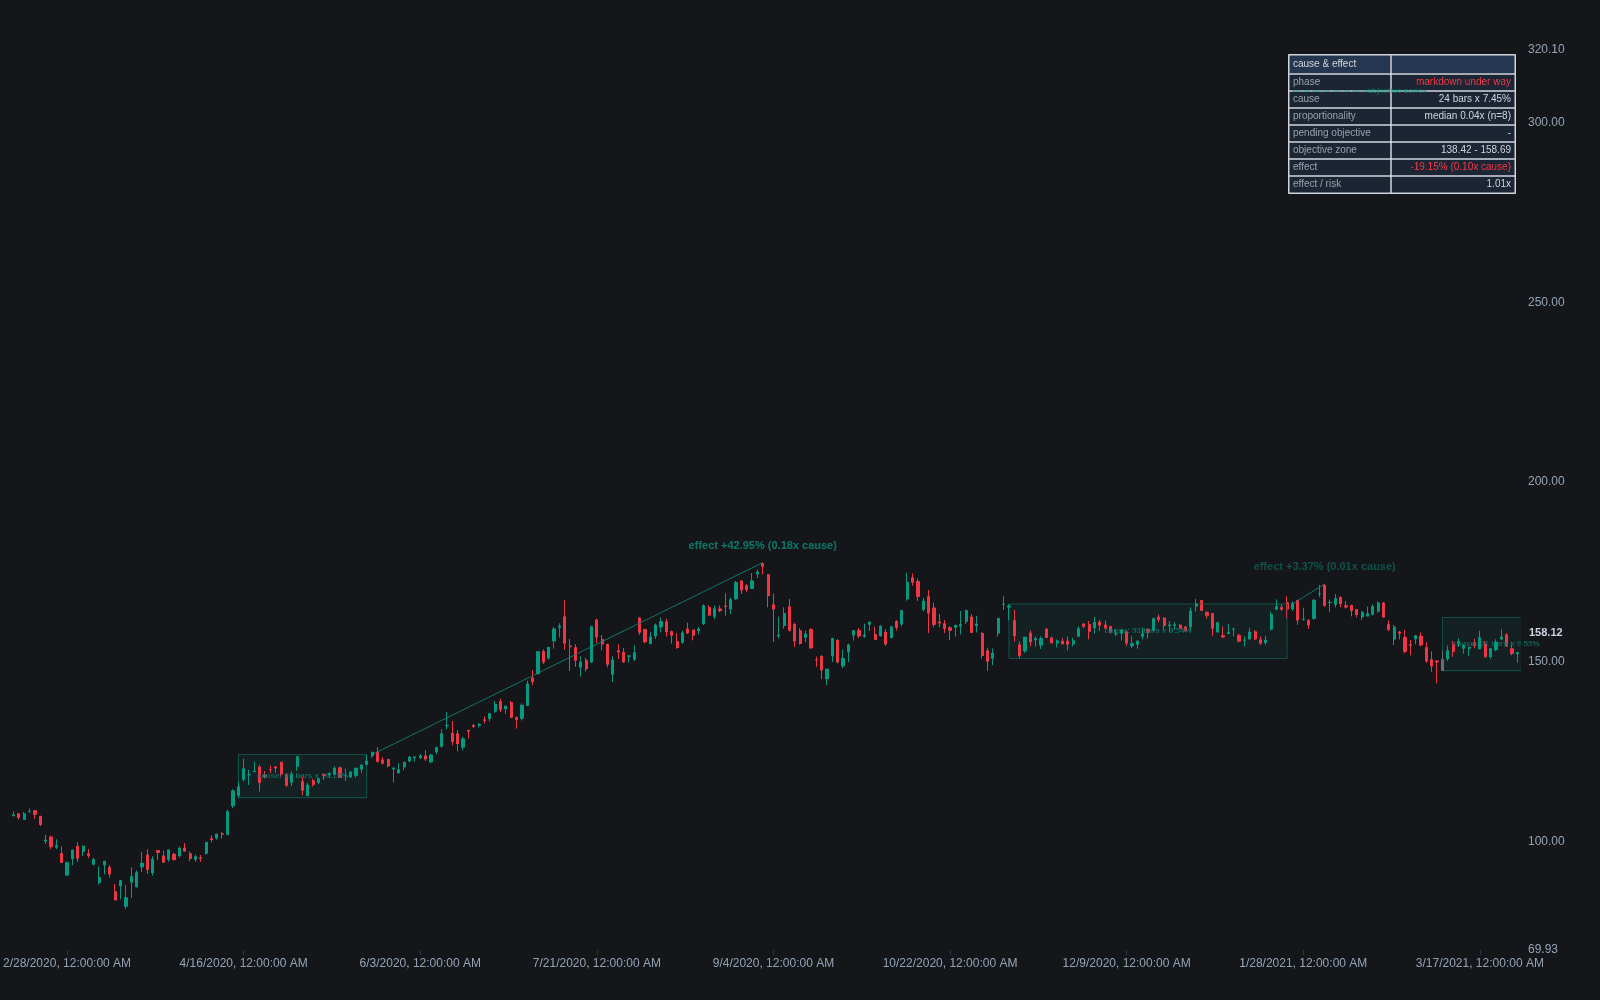
Cause & Effect is a Wyckoff concept. The Library holds 1 implementation, a working definition you can pull into Quant.
range → move proportionality
Top Cause & Effect indicator
The top custom implementation, built on the original standard Cause & Effect formula.
1 total
From studying Cause & Effect to trading it: take the implementation below into Quant and backtest it instantly.
What is the law of cause and effect?
Cause and effect is one of the three fundamental laws of the Wyckoff Method, alongside supply and demand and effort vs result. It states that market moves do not come from nowhere: the extent of a trend (the effect) tends to be proportional to the amount of preparation (the cause) that preceded it. In practice the cause is the accumulation or distribution built inside a trading range, and the effect is the markup or markdown that follows. A long, well-developed range represents a large transfer of positions and can fund a large move; a brief pause can fund only a small one.
The law exists to answer a question the other Wyckoff laws do not: not whether price will move, or in which direction, but how far it might reasonably travel. Wyckoff's insight was that campaigns require inventory, and inventory changes hands sideways. The bigger the campaign being assembled in a range, the more fuel exists for the trend, because the positions accumulated must eventually be marked to prices where they can be profitably distributed, and vice versa.
Traders care because the law converts range analysis into an expectation of magnitude, which feeds directly into whether a trade is worth taking. It is measured concretely through point & figure cause counting, where the horizontal width of the range is projected into a price objective. The proportionality is a tendency observed by practitioners over a century of use, not a physical law: causes sometimes fail to produce their projected effects, and external shocks produce effects with no visible chart cause at all.
How traders use it
- To size the opportunity before entry: traders compare the projected effect of a base against the risk required to trade it, and skip structurally valid setups whose cause is too small to pay for the risk. This check is built into the nine buying and selling tests.
- To set campaign objectives: the count-derived objective zone gives position traders a rational place to begin scaling out, rather than exiting on the first pullback or holding on hope.
- To distinguish pauses from endings: when a trend consolidates, a fresh count across the pause is compared with the original objective; a pause projecting in line with the campaign supports holding, part of the re-accumulation versus distribution diagnosis.
- To calibrate patience: the law implies that big moves need big preparation, so traders expecting a major trend from a two-week base are, on this view, expecting an effect without a sufficient cause.
- With its limits stated: proportionality is loose, objectives are zones rather than levels, and the law says nothing about timing or about news-driven moves that arrive without visible preparation.
Cause and effect vs related measurement ideas
Point & figure cause counting: Cause counting is the measuring instrument for the law: it turns the qualitative claim, bigger causes yield bigger effects, into a numeric objective by counting columns across the range on a point & figure chart.
Effort vs result: Effort vs result is a bar-scale and swing-scale law comparing volume with price progress right now. Cause and effect operates at campaign scale, comparing the size of a completed range with the trend it produces.
Measured move: The measured move projects a prior vertical swing forward, symmetry of legs. Cause and effect projects horizontal preparation into vertical movement, a different and distinctly Wyckoffian geometry.
Concept family
Wyckoff
17 concepts mapped · 17 in the Library
Cause & Effect FAQ
Turn Cause & Effect into a trading strategy.
Take the implementation from this page into Quant, then build on it, backtest it on real data, and keep refining it in conversation.