Point & Figure Cause Counting
 By LuxAlgoMar 29, 2026
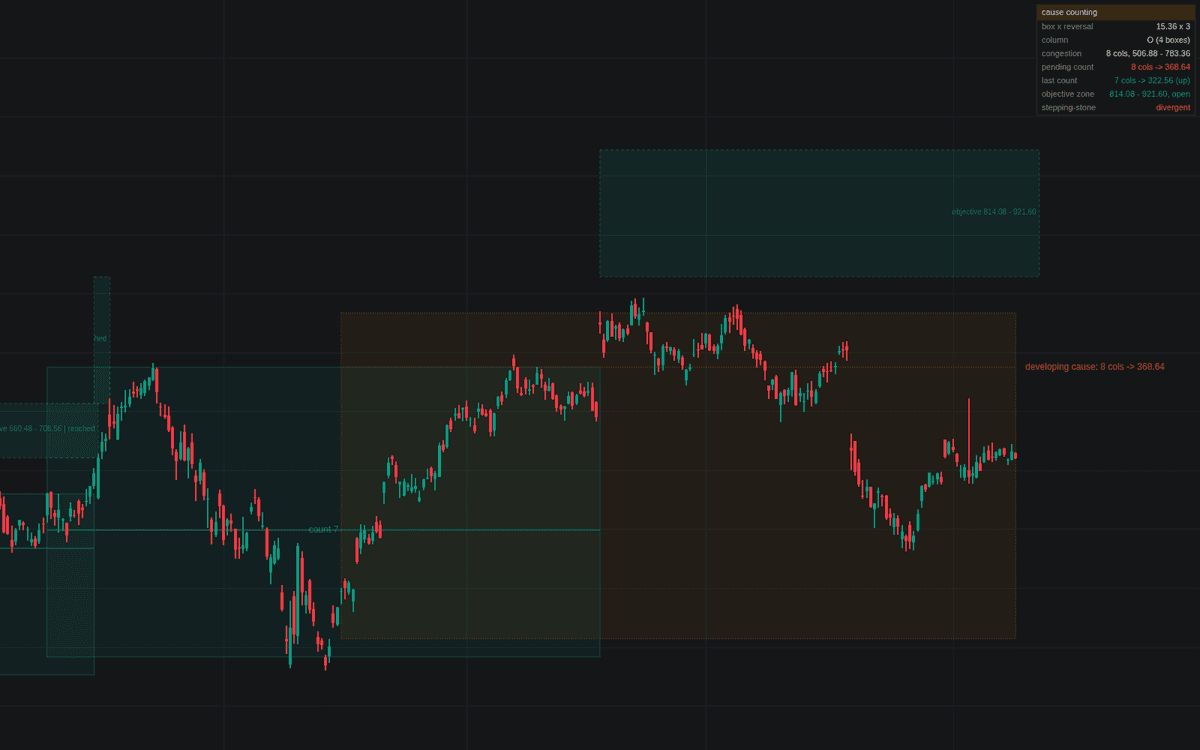

Point & Figure Cause Counting performs the Wyckoff horizontal count automatically, the first working build of point & figure cause counting in the library. It reconstructs a point & figure grid from the chart's bar history, and when a breakout resolves a congestion it draws the count line at the row crossing the most printed columns, multiplies columns by box size and reversal, and posts the projection as a zone: conservative edge anchored at the range extreme, aggressive edge at the count line.
How to Trade the Point & Figure Cause Counting?
- Count posted: a congestion at least Minimum Range Width wide resolved; the "count N" label carries the full arithmetic in its tooltip.
- Objective zone: the shaded span between the two targets, an area where the projected effect is spent, not a precise level.
- Stepping-stone: a fresh count converging with the campaign base zone supports staying with the position; the dashboard grades each.
- Developing preview: the dotted range shows the pending count and both would-be objectives, the pre-entry check of whether the base projects far enough.
The build anchors the measuring side of the Wyckoff toolkit.
Point & Figure Cause Counting Settings
- Box Size Method (default Auto (ATR)) with ATR Length (default 14); Box Percent (default 1) and Fixed Box Size (default 1) serve the manual modes.
- Reversal (Boxes) (default 3) and Column Source (default High/Low): grid construction.
- Minimum Range Width (Columns) (default 5), Count Line Fill (%) (default 60), Breakout Threshold (Boxes) (default 1): what qualifies as a countable cause.
- Stepping-Stone Tolerance (%) (default 10): slack when comparing a new count with the campaign base.
- Calculation Window (Bars) (default 2000) and Completed Counts Kept (default 4), plus dashboard and drawing toggles.
Frequently Asked Questions

Original indicatorBuilt in-house by LuxAlgo
The Library is free. Quant makes it yours.
Pull any concept or indicator into Quant: rebuild it, retune it, or turn it into a backtested strategy of your own.