Concept
Chande Momentum Oscillator
Chande Momentum Oscillator is a Momentum & Oscillators concept. The Library holds 1 implementation, a working definition you can pull into Quant.
CMO
The standard Chande Momentum Oscillator indicator
Chande Momentum Oscillator exactly as classically defined: the faithful reference build of the original formula, free to run in Quant.
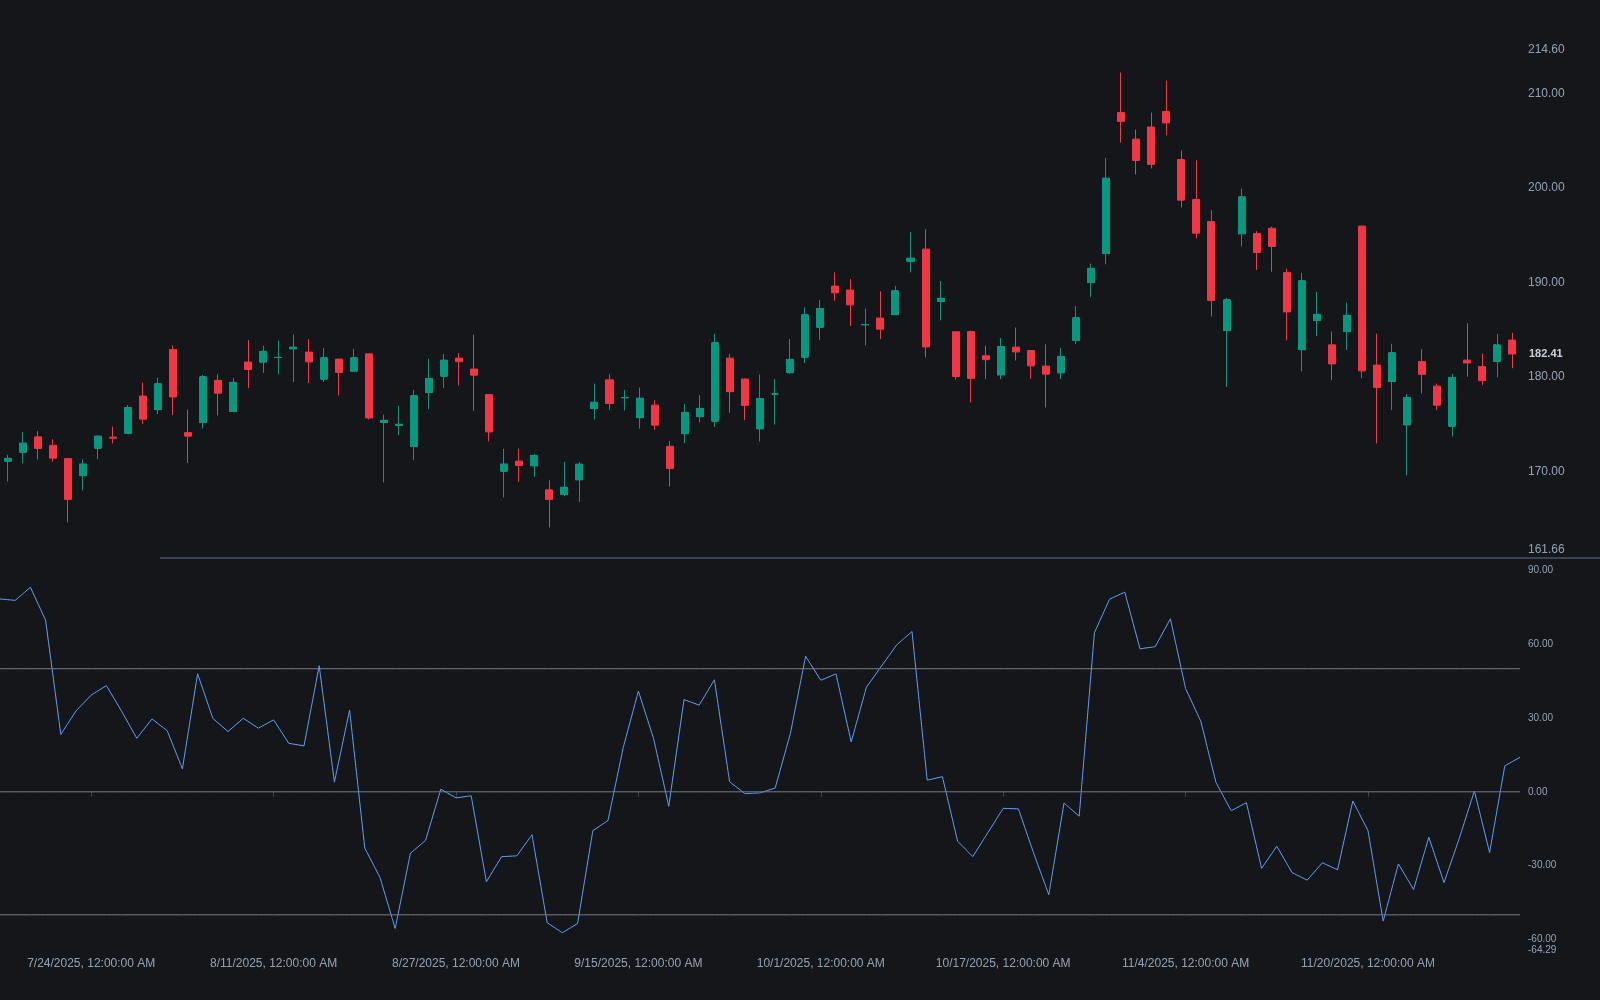
What is the Chande Momentum Oscillator?
The Chande Momentum Oscillator (CMO) is a bounded momentum oscillator introduced by Tushar Chande. Over a lookback window it sums the gains on up closes (Su) and the absolute losses on down closes (Sd), then computes 100 times (Su minus Sd) divided by (Su plus Sd). The result swings between +100 and -100, reaching an extreme only when every bar in the window closed in the same direction, and sitting at zero when gains and losses balance.
The construction is deliberately close to RSI with two differences: the sums are raw rather than smoothed, and the scale is symmetric around zero rather than 0 to 100. With the same window and simple averaging, CMO is a linear rescale of RSI (two times RSI minus 100); in practice the values differ because standard RSI uses Wilder's smoothing. The unsmoothed sums make CMO snappier, and noisier, than RSI at the same length.
Chande introduced the CMO in The New Technical Trader (1994), co-written with Stanley Kroll, as part of a set of tools meant to modernize classic designs; the same book presented VIDYA, his variable-index moving average. The stated aim was a purer momentum reading: Wilder's smoothing inside RSI stabilizes the line but blurs exactly the short bursts a momentum trader may want to see. By summing raw gains and losses, the CMO reports the window's one-sidedness as it stands, and by centering the scale on zero it makes the neutral point explicit rather than burying it at 50.
The symmetric scale is more than cosmetic. Zero marks genuine balance between up and down movement, so the sign is a compact regime read, and thresholds mirror cleanly for long and short analysis. The absolute value doubles as a trendiness gauge: |CMO| near 100 means recent closes moved almost entirely one way, values near zero mean churn, and that property is what Chande reused as the volatility index inside VIDYA. Its relatives frame the tradeoffs: ROC is unbounded and referenced to a single old bar, and raw momentum is an unnormalized point difference, while the CMO normalizes by total movement so readings stay comparable across quiet and volatile stretches.
How to identify Chande Momentum Oscillator signals on a chart
The CMO plots in its own panel between +100 and -100, with the zero line and the +50/-50 extremes as reference levels.
- 1Read the sign first: above zero, up closes have outweighed down closes over the window; below zero, the reverse.
- 2Mark visits to +50 and -50, the conventional extreme thresholds, and note how this market has recently resolved them, by reversing or by trending onward.
- 3Expect a jagged line: with raw sums, the level the CMO holds for several bars matters more than any single-bar spike.
- 4Compare swing extremes against price: a new price high with a lower CMO high shows the window's one-sidedness fading, the standard regular divergence template.
- 5If a smoothed copy is overlaid, watch crossings of the CMO and its signal line for earlier, noisier triggers.
How it's calculated
Bounded momentum oscillator comparing the sum of up-closes to the sum of down-closes over the lookback, scaled to -100..+100.
Published by Tushar Chande (1994); unlike RSI the sums are unsmoothed, so CMO reacts faster and is symmetric around zero.
Common overbought/oversold thresholds are +50 and -50.
CMO_t = 2 × RSI_t - 100 when RSI is computed with simple sums instead of Wilder smoothing.
How traders use it
- As an overbought/oversold gauge: +50 and -50 are the conventional extreme thresholds, with the usual caveat that readings can stay pinned during strong trends.
- As a zero-line regime read: the sign of CMO tells whether recent closes have netted up or down, a simple directional filter.
- As a trendiness input: the absolute value of CMO measures how one-sided recent movement is, which is how it drives the adaptive smoothing inside VIDYA.
- As a divergence tool: because the sums are unsmoothed, CMO swing extremes register sharply, making both regular and hidden divergence legible, at the cost of more candidate swings to filter.
CMO vs adjacent momentum oscillators
RSI: The nearest relative: the same gain-versus-loss comparison, but RSI applies Wilder's smoothing and maps to 0-100 while the CMO uses raw sums on a symmetric scale. In practice the CMO turns faster and noisier, and its zero line makes the regime midpoint explicit where RSI puts it at 50.
ROC: ROC measures the percentage change from a single close n bars ago: unbounded, and sensitive to the reference bar dropping out of the window. The CMO uses every bar and bounds the result, so extreme readings stay comparable across instruments and volatility regimes.
Stochastic Oscillator: The stochastic locates the close within the recent high-low range, a position measure that can read extreme after a slow drift to the range edge. The CMO measures net close-to-close movement, so it captures directional force rather than location within the range.
Concept family
Momentum & Oscillators
91 concepts mapped · 91 in the Library
Chande Momentum Oscillator FAQ
Turn Chande Momentum Oscillator into a trading strategy.
Take the implementation from this page into Quant, then build on it, backtest it on real data, and keep refining it in conversation.