Constance Brown Studies
 By LuxAlgoMar 5, 2026
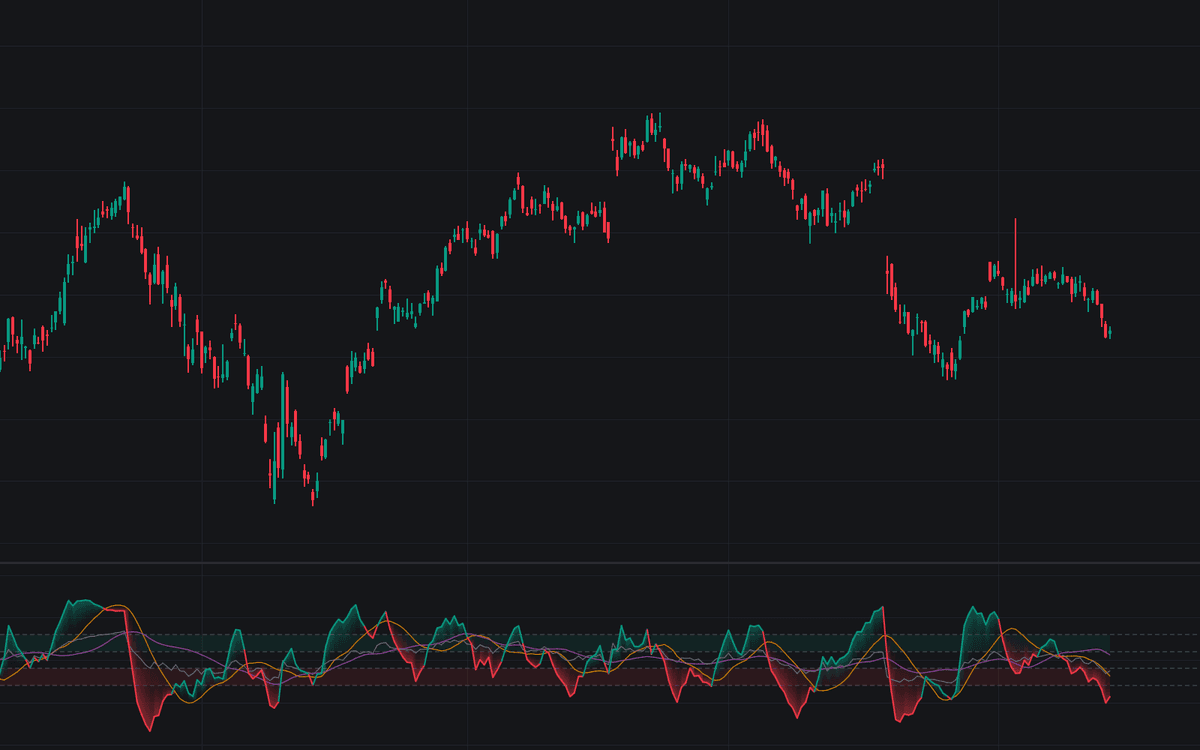

Constance Brown Studies gathers the published Constance Brown studies into one pane: the Composite Index (the 14-period RSI's 9-bar momentum added to a smoothed 3-period RSI) with its 13 and 33 period signal averages, the Derivative Oscillator histogram, and the base RSI with its operating ranges marked. The Composite's momentum term has no 0-100 bound, so it keeps traveling where RSI pins against its scale.
How to Trade the Constance Brown Studies?
- Divergence between the lines: a swing extreme where the Composite Index disagrees with RSI is the warning the unbounded scale exists to expose.
- Trigger cross: the Composite crossing its fast average is the mechanical trigger layered onto the divergence read.
- Range shift: RSI clearing 60 marks bull-range behavior, losing 40 the bear range: the regime tell.
- Histogram flip: the Derivative Oscillator crossing zero turns the momentum read; bars losing height say thrust is draining.
Constance Brown Studies Settings
- Source (default close): series the RSIs run on.
- RSI Length (default 14): length of the base RSI.
- Show RSI (default on): keeps the base line in the pane.
- Momentum Length (default 9): bars behind the momentum term.
- Fast RSI (default 3) and Smoothing (default 3): the smoothed short-RSI term.
- Fast Average (default 13) and Slow Average (default 33): signal averages; the fast one is the trigger.
- Show Signal Averages (default on): plots the pair.
- Show Histogram (default off): adds the Derivative Oscillator columns.
- First EMA (default 5), Second EMA (default 3) and Signal SMA (default 9): define the histogram.
- Range Zone Shading (default on), Bull Floor (default 40) and Ceiling (default 80), Bear Floor (default 20) and Ceiling (default 60): the RSI operating ranges and their shading.
- Style inputs cover line colors, the trigger gradient and optional trigger markers.
Frequently Asked Questions

Original indicatorBuilt in-house by LuxAlgo
The Library is free. Quant makes it yours.
Pull any concept or indicator into Quant: rebuild it, retune it, or turn it into a backtested strategy of your own.