Concept
Constance Brown Studies
Constance Brown Studies, also known as Derivative Oscillator, Composite Index, are Momentum & Oscillators concepts. The Library holds 1 implementation, a working definition you can pull into Quant.
Top Constance Brown Studies indicator
The top custom implementation, built on the original standard Constance Brown Studies formula.
1 total
This Constance Brown Studies implementation is strategy-ready: open it in Quant, set your rules, and it backtests automatically.
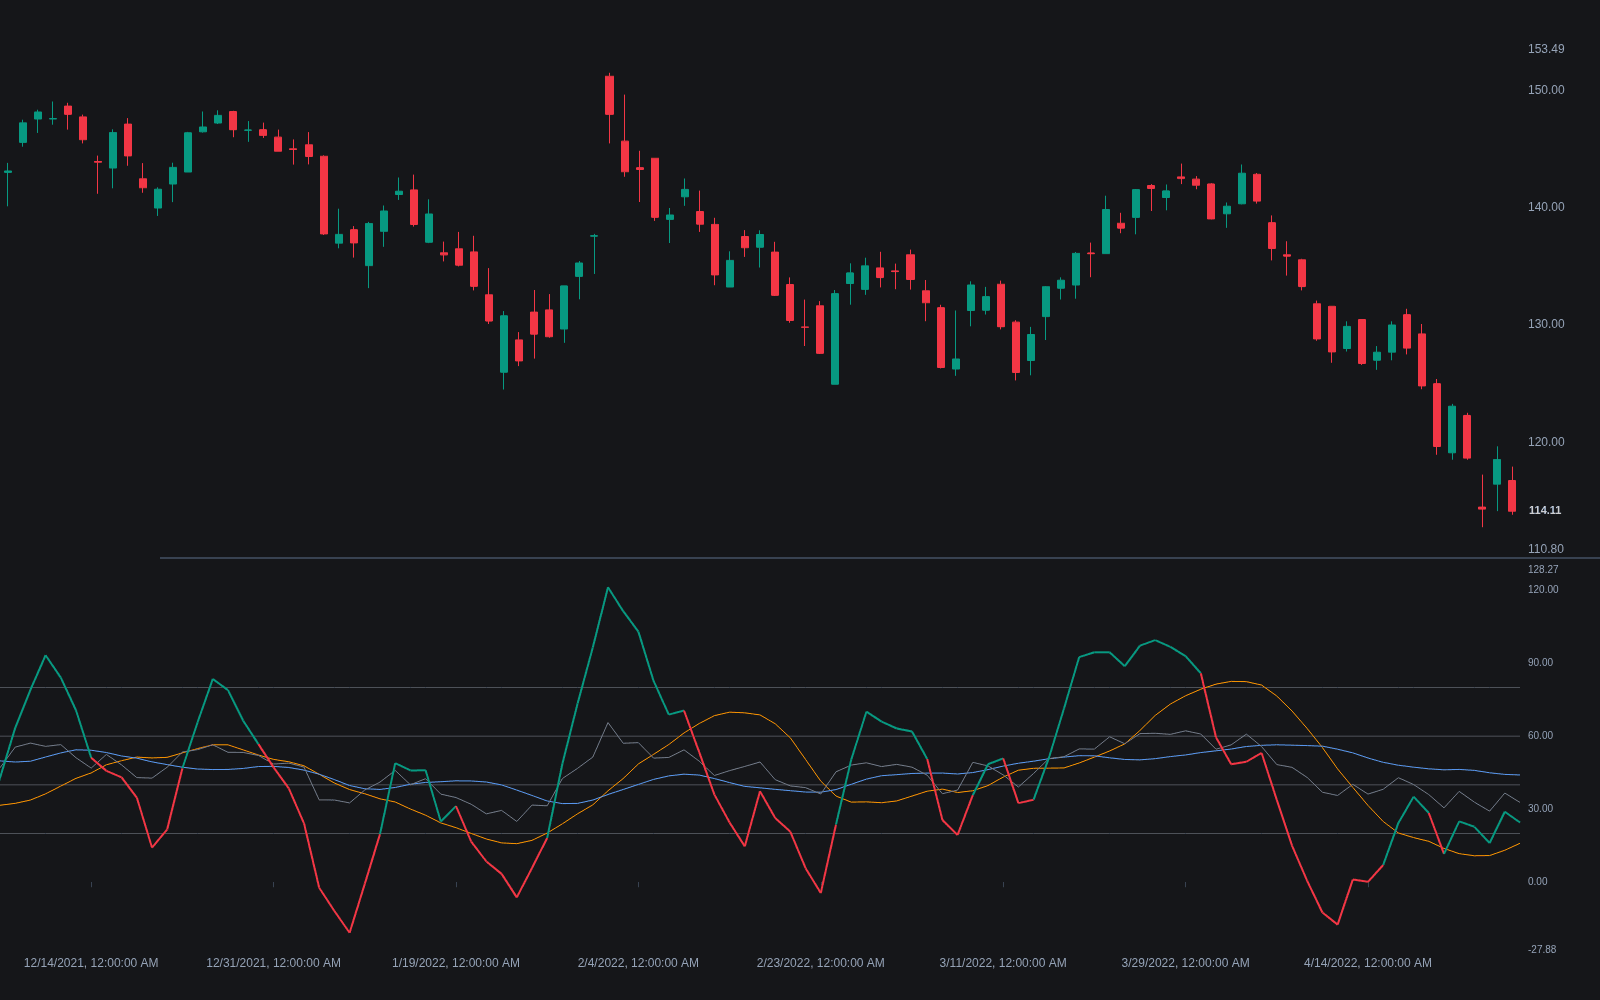
What are the Constance Brown Studies?
The Constance Brown Studies are a family of RSI-derived momentum tools from Constance Brown's Technical Analysis for the Trading Professional (1999), each built to repair a specific weakness of RSI rather than replace it. The best known is the Composite Index: as published, the 9-bar momentum of a 14-period RSI added to a 3-bar simple average of a 3-period RSI. Removing RSI's bounded 0-100 scale is the point; the unbounded line can keep stretching where RSI flattens, so it can print divergences that RSI's compression near its extremes hides.
The second study is the Derivative Oscillator: a 14-period RSI smoothed twice, with a 5-period and then a 3-period exponential average, minus a 9-period simple average of that double-smoothed line, plotted as a histogram. Brown also reframed how RSI's operating range shifts between bull and bear regimes; that thread of her work is covered under RSI range rules.
The design problem behind the Composite Index deserves spelling out. RSI's averaging caps how far it can travel: in a runaway move the oscillator pins near its extreme and physically cannot make a higher high, so it prints divergence whether or not momentum is genuinely fading, and fails to print it when the fade is real but the scale is saturated. Bolting an unbounded momentum term onto the RSI stream removes the ceiling. When RSI and the Composite Index disagree at a price extreme, the disagreement itself is Brown's signal: the bounded line's testimony has been checked against a witness that cannot be silenced by its own scale.
On the Library the studies live mostly as divergence engines: LazyBear's port pairs the Composite Index with RSI and its averages on one panel, and z3bazi's and shayankm's builds automate the divergence detection between the two lines. The honest caveats are those of any derivative-of-a-derivative: the Derivative Oscillator's double smoothing buys clean histogram flips with real lag, the Composite Index's unbounded scale means its levels only make sense relative to their own recent history, and every read remains a momentum read, needing price structure to convert warnings into trades.
How to identify the Constance Brown studies
Two constructions, both starting from RSI: one un-bounds it, the other smooths it into a histogram.
- 1Composite Index, term one: compute a 14-period RSI, then its 9-bar momentum, the unbounded ingredient.
- 2Composite Index, term two: a 3-bar simple average of a 3-period RSI, the fast bounded ingredient; sum the two terms.
- 3Overlay the index's own moving averages, as Brown plotted them, so crosses of the study through its averages give mechanical triggers.
- 4Derivative Oscillator: double-smooth a 14-period RSI with 5- then 3-period EMAs, subtract a 9-period SMA of the result, plot as a histogram.
- 5Read the pair the intended way: Composite Index divergence checked at RSI's swing points, histogram zero-crosses and shrinking bars for timing.
How it's calculated
Two Constance Brown momentum studies built on the 14-period RSI: the Composite Index (line 1) and the Derivative Oscillator (lines 2 to 4).
Composite Index defaults are 14, 9 and 3; it is usually plotted with 13-period and 33-period simple moving averages of itself as reference lines.
Derivative Oscillator defaults are 14, 5, 3 and 9 and it is drawn as a histogram; some platforms use an EMA instead of an SMA for the 9-period signal.
Both studies are published in Brown's Technical Analysis for the Trading Professional.
How traders use it
- Cross-checking divergence: the Composite Index is read at RSI's swing highs and lows, and a divergence that shows on one line but not the other is the warning, the Composite catching what RSI's bounded scale conceals.
- Timing momentum flips with the Derivative Oscillator histogram: zero-line crosses and shrinking bars carry the same grammar as a MACD histogram, applied to double-smoothed RSI.
- Trigger construction: Brown plotted the studies with moving averages of themselves, so a study crossing its own average adds a mechanical trigger to the divergence read.
- As automated divergence engines: detector builds flag disagreements between the Composite Index and RSI at swing points, converting Brown's visual cross-check into alerts.
- Within regime context: the studies inherit Brown's range framework, so bullish divergences are weighted more when RSI is operating in its bull-regime range and faded reads are demoted when the regime disagrees.
Constance Brown studies vs related momentum tools
RSI: The parent indicator, kept on the chart deliberately: the studies are read against RSI, not instead of it. The Composite Index exists precisely because RSI's bounded scale suppresses divergence information at the extremes where it matters most.
Stochastic RSI: Both are RSI derivatives attacking different complaints. Stochastic RSI stretches the oscillator's range to amplify sensitivity, adding noise; the Composite Index un-bounds the scale to recover hidden divergence, adding stretch. Amplification versus liberation.
MACD: The Derivative Oscillator borrows MACD's histogram grammar, zero-line crosses and fading bars, but builds it from double-smoothed RSI rather than price averages. Same reading skills transfer; the input stream and its saturation behavior differ.
Concept family
Momentum & Oscillators
91 concepts mapped · 91 in the Library
Constance Brown Studies FAQ
Turn Constance Brown Studies into a trading strategy.
Take the implementation from this page into Quant, then build on it, backtest it on real data, and keep refining it in conversation.