Coral Trend
 By LuxAlgoApr 25, 2026
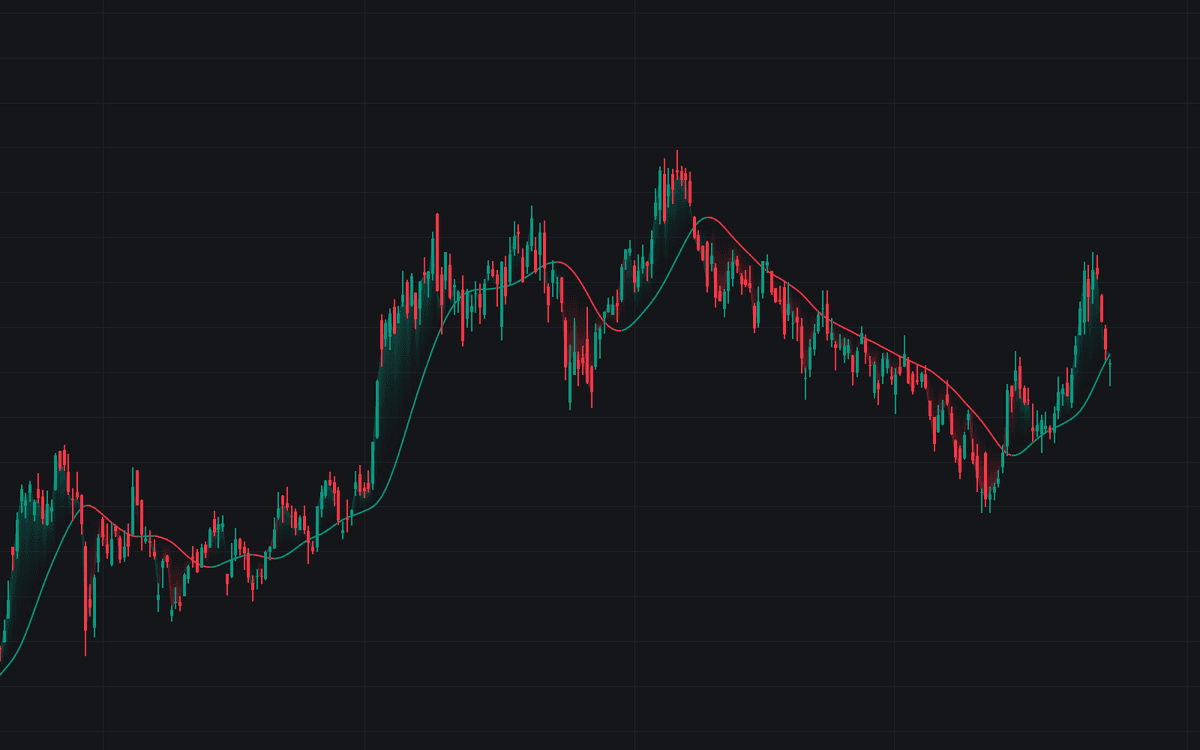

Coral Trend is the definitive clean build of the Coral Trend filter: six identical one-pole exponential smoothing stages run in series, then recombined with weights built from one lag-compensation constant so much of the stacked lag cancels out. What remains is a deliberately unhurried curve that rounds through turns instead of chattering, painted in its bullish shade while climbing and its bearish shade while sinking. The color, standing in for slope, is the entire signal.
How to Trade the Coral Trend?
- Color flip: the line's slope turning up or down is the trend call; both directions carry alerts, with optional dot markers at the flip.
- Pullback to the line: the gradient fill makes stretch from the curve visible, so a return toward a still-rising line reads as a trend-joining spot rather than a change of regime.
- Price cross: crossings of the line itself fire separate bullish and bearish alerts for traders who want an earlier, noisier trigger.
- Clustered flips: several color changes stacked close together warn of a range: the filter has nothing to grip.
Coral Trend Settings
- Source (default close): the series fed through all six smoothing stages.
- Smoothing Period (default 21): sets the single pole shared by the cascade. Longer periods give a rounder line with fewer, later color flips; shorter ones flip earlier but more often.
- Constant D (default 0.4): the lag-compensation weight. Higher values make the line livelier but overshoot around sharp turns; at 0 the compensation switches off and the output collapses to the bare triple-smoothed stage.
- Style inputs set the rising, falling and flat colors, line width, the price gradient fill and the optional flip markers.
Frequently Asked Questions

Original indicatorBuilt in-house by LuxAlgo
The Library is free. Quant makes it yours.
Pull any concept or indicator into Quant: rebuild it, retune it, or turn it into a backtested strategy of your own.