Custom Indices/baskets
 By LuxAlgoJun 8, 2026
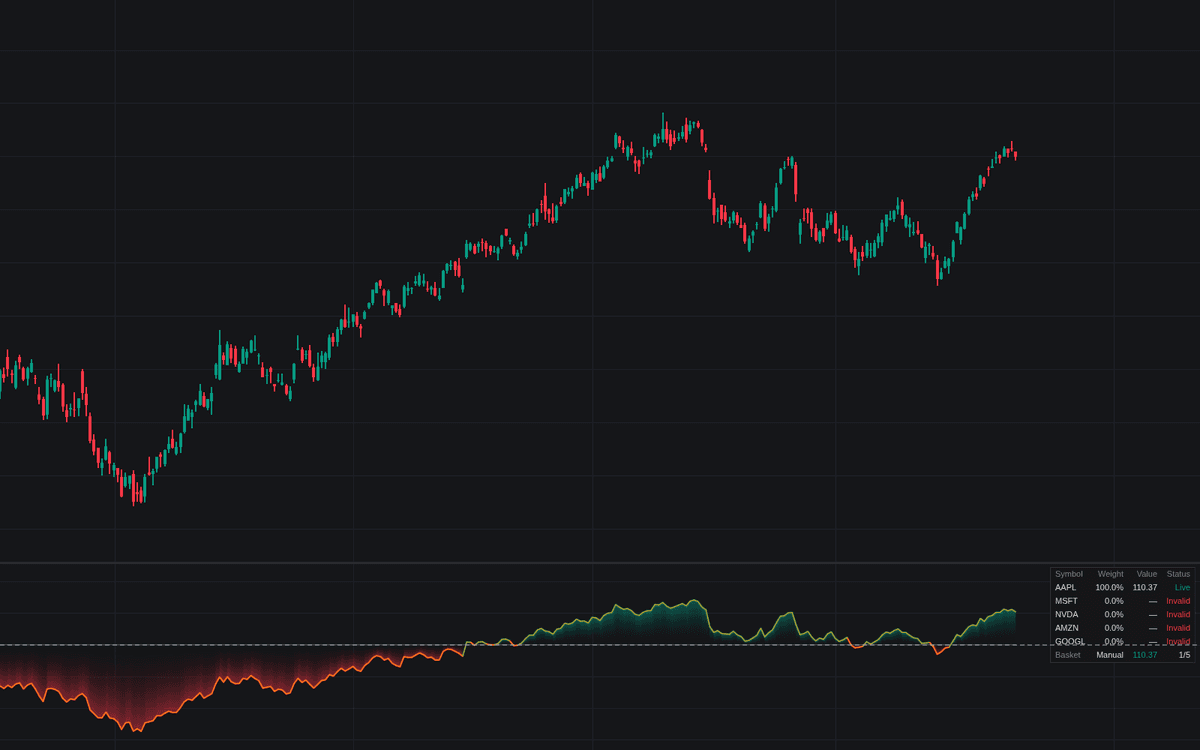

Custom Indices/baskets is the definitive clean builder for a custom index or basket: up to ten constituents aggregated into one synthetic series. Rebased Prices lets weights drift like a buy-and-hold portfolio; Compounded Returns re-applies the weights every bar like a continuously rebalanced basket, with equal, manual or liquidity weighting and optional currency conversion.
How to Trade the Custom Indices/baskets?
- Symbol against basket: the comparison line treats the chart symbol exactly like the basket; crossings fire leading and lagging alerts.
- Constituent spread: the member lines show whether a move is basket-wide or one ticker's story.
- Level crosses: the alert level watches the synthetic scale; execution happens leg by leg at real quotes.
Custom Indices/baskets Settings
- Construction (default Rebased Prices): rebased weighted average, or compounded weighted returns.
- Base Value (default 100): the level every series is rebased to.
- Weighting (default Manual): Equal, per-symbol weights, or Liquidity by traded value.
- Liquidity Length (default 50): lookback for the traded-value average.
- Basket Timeframe (default chart): sampling timeframe; daily closes tame mismatched sessions.
- Currency Conversion (default None): converts every leg to one currency first.
- Rebase Start (default First Available Bar) and Custom Start Date (default 01 Jan 2024): where each series begins.
- Symbol 1 through Symbol 10, each with a weight (default 1): the constituents; empty slots are skipped.
- Chart Symbol Comparison (default on): overlays the chart symbol, processed identically.
- Alert Level (default 100, hidden by default): the cross-alert level.
- Show Dashboard (default on): per-constituent weight, level and status.
- Style inputs cover the line colors, constituent lines and the base gradient fill.
Frequently Asked Questions

Original indicatorBuilt in-house by LuxAlgo
The Library is free. Quant makes it yours.
Pull any concept or indicator into Quant: rebuild it, retune it, or turn it into a backtested strategy of your own.