Concept
Custom Indices/baskets
Custom Indices/baskets are Meta & Composition concepts. The Library holds 1 implementation, a working definition you can pull into Quant.
Top Custom Indices/baskets indicator
The top custom implementation, built on the original standard Custom Indices/baskets formula.
1 total
From studying Custom Indices/baskets to trading it: take the implementation below into Quant and backtest it instantly.
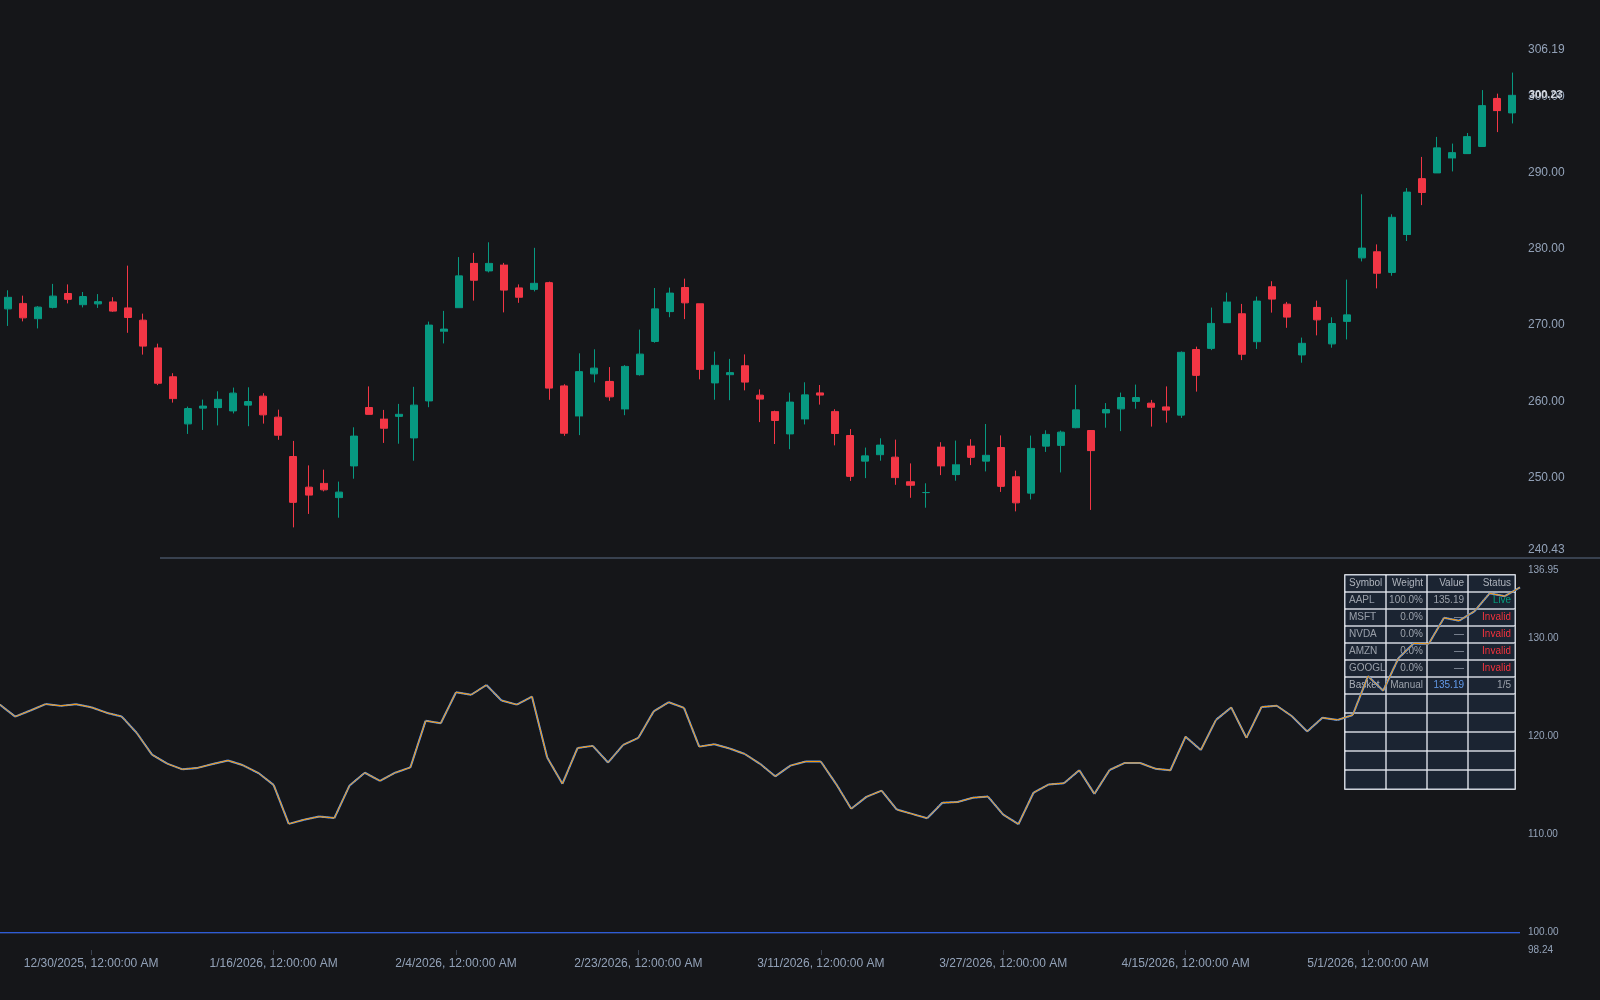
What are Custom Indices/baskets?
A custom index or basket is a synthetic series built from several instruments and then charted like a single symbol. Examples span an equal- or cap-weighted average of a sector, one currency measured against a weighted set of counterparts (the logic behind a currency strength meter), a volume-weighted composite of the same asset across venues, or a macro aggregate such as global money supply converted to one currency and summed. Construction is arithmetic on aligned series: pick constituents, pick weights, normalize units, aggregate.
The point is isolation. Averaging venues suppresses exchange-specific quirks; weighting a theme measures the theme rather than one ticker's idiosyncrasies. Where a basket aggregates many series into one, the sibling transform expresses one series against another as a ratio or spread; both are forms of cross-instrument composition, arithmetic that manufactures a new chartable series from existing ones.
The construction is as old as market averages. Charles Dow's first stock average of 1884, drawn mostly from railroads, and his industrial average of 1896 were hand-built baskets, simple price averages meant to read the market rather than any single stock, and index providers later moved to capitalization weighting for broad benchmarks. What changed recently is access: charting platforms now accept arithmetic directly in the symbol box, so a trader can sum, scale, and divide tickers into a bespoke series without leaving the chart, from multi-exchange composites of bitcoin to a global money-supply aggregate expressed in dollars.
The hazards are mechanical. Constituents trade different sessions, so parts of the basket go stale while others print; weights drift unless rebalanced; currency conversion embeds a second market inside the series; and a long-lived composite usually needs a logarithmic chart scale before its early history is readable. Every indicator computed on the synthetic series inherits every construction choice behind it, so signal hygiene, knowing what the numbers actually are before trusting what they say, matters more here than on an exchange-listed symbol.
How to build a custom index or basket
There is nothing to spot on a chart: the series exists because you construct it. These steps are the construction checklist.
- 1Define the question first: a theme read, a cleaner reference price, or a macro backdrop each imply different constituents, weights, and update frequency.
- 2Choose constituents that all express that one question, and convert them to a common currency or unit so the arithmetic compares like with like.
- 3Pick a weighting rule: equal weights for a democratic theme read, capitalization or liquidity weights to mirror economic size, or fixed weights you can justify; decide whether and when they rebalance.
- 4Combine the series with symbol arithmetic or a script, aligning calendars and deciding how bars where a constituent did not trade are handled.
- 5Sanity-check the result against a known benchmark: a sector basket that diverges wildly from the sector's listed index usually reveals a construction bug rather than a discovery.
How traders use it
- As a theme or breadth read: charting a hand-built sector or factor basket shows whether a move in one name is idiosyncratic or shared, a lightweight, chart-level complement to broader intermarket work.
- As a cleaner reference price: multi-venue composites give one reference series for fragmented assets, useful for anchoring levels and alerts when no single exchange's print is authoritative.
- As a slow regime input: macro aggregates such as combined money supply series are used as background risk-on or risk-off context sitting at the top of a top-down analysis rather than as entry signals in their own right.
- As a relative benchmark: charting one name against its hand-built peer basket separates stock-specific action from group action, sharpening leader-versus-laggard reads before committing to the single name.
- As an input to composite tooling: a basket series can feed composite oscillators or a confluence scoring system, letting one summary series stand in for a dozen separate inputs.
Custom Indices/baskets vs. related concepts
Cross-instrument Composition: Cross-instrument composition is the umbrella technique, any calculation that spans multiple symbols; a custom index is its most common product, a single aggregated series meant to be charted like a ticker.
Composite Oscillators: A composite oscillator merges several indicators into one reading about a market, while a basket merges several instruments into the market itself; one summarizes evidence, the other manufactures the series to be analyzed.
Confluence & Scoring Systems: Confluence and scoring systems combine signals at decision time; a basket does its combining upstream in the data, before any signal logic runs, so the two are complementary rather than competing.
Concept family
Meta & Composition
28 concepts mapped · 28 in the Library
Custom Indices/baskets FAQ
Turn Custom Indices/baskets into a trading strategy.
Take the implementation from this page into Quant, then build on it, backtest it on real data, and keep refining it in conversation.