Line Break
 By LuxAlgoJul 31, 2026
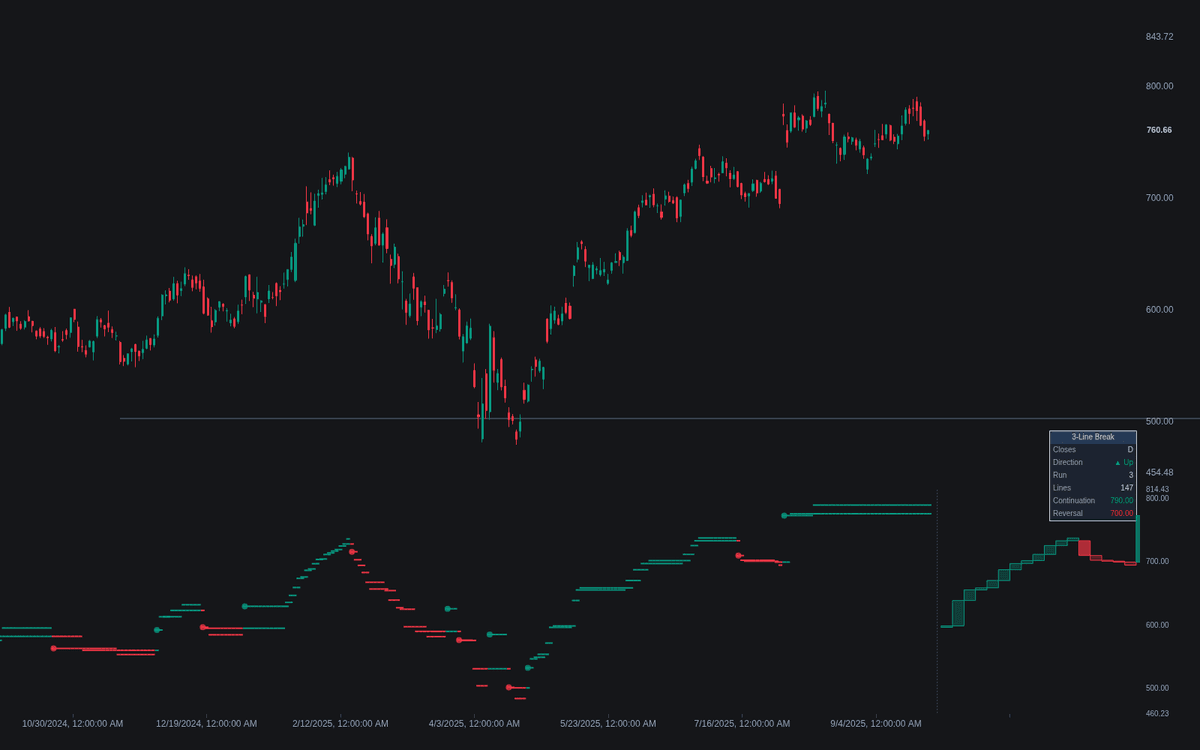

Line Break rebuilds price from closes alone under the classic asymmetric filter: continuation needs only a close beyond the last line, reversal a close past the extreme of the prior lines. The default three-line lookback gives the traditional 3LB form of the line break chart, drawn two ways at once - a synthetic equal-width chart beside the last bar, and stepped Line Top / Line Bottom plots that shade the active line across chart time, dating every line to the close that printed it. Both trigger prices sit in the dashboard and plot on the price chart.
How to Trade the Line Break?
- Turnaround line: the signal the chart is read for - a close erasing the full extreme of the prior lines prints a more opaque reversal line, a circle marker and the matching alert.
- Continuation lines: closes beyond the last line keep the run alive on modest progress; the dashboard counts the running length.
- Extended run: a run reaching the configured length fires the Extended Run alert - practitioners treat late lines in long sequences as fragile.
- Trigger levels: the exact prices a close must beat print over the candles, so breakouts can be cross-checked against standard bars.
Line Break Settings
- Line Break Count (default 3): prior lines a reversal must erase; 2 reverses more easily, higher counts give slower charts.
- Close Timeframe (default chart timeframe): closes feeding the lines; higher timeframe closes are processed only once confirmed.
- Extended Run Length (default 8): consecutive same-color lines treated as an extended run.
- Line Break Chart (on) with Chart Lines (default 30) and Width (default 2): the synthetic chart.
- Display toggles - Historical Lines, Turnaround Markers and Trigger Levels On Price Chart (all on), Color Price Chart Candles (off) - plus Show Dashboard (on, Top Right, Small).
Frequently Asked Questions

Original indicatorBuilt in-house by LuxAlgo
The Library is free. Quant makes it yours.
Pull any concept or indicator into Quant: rebuild it, retune it, or turn it into a backtested strategy of your own.