Execution Algo Footprints
 By LuxAlgoJun 30, 2026
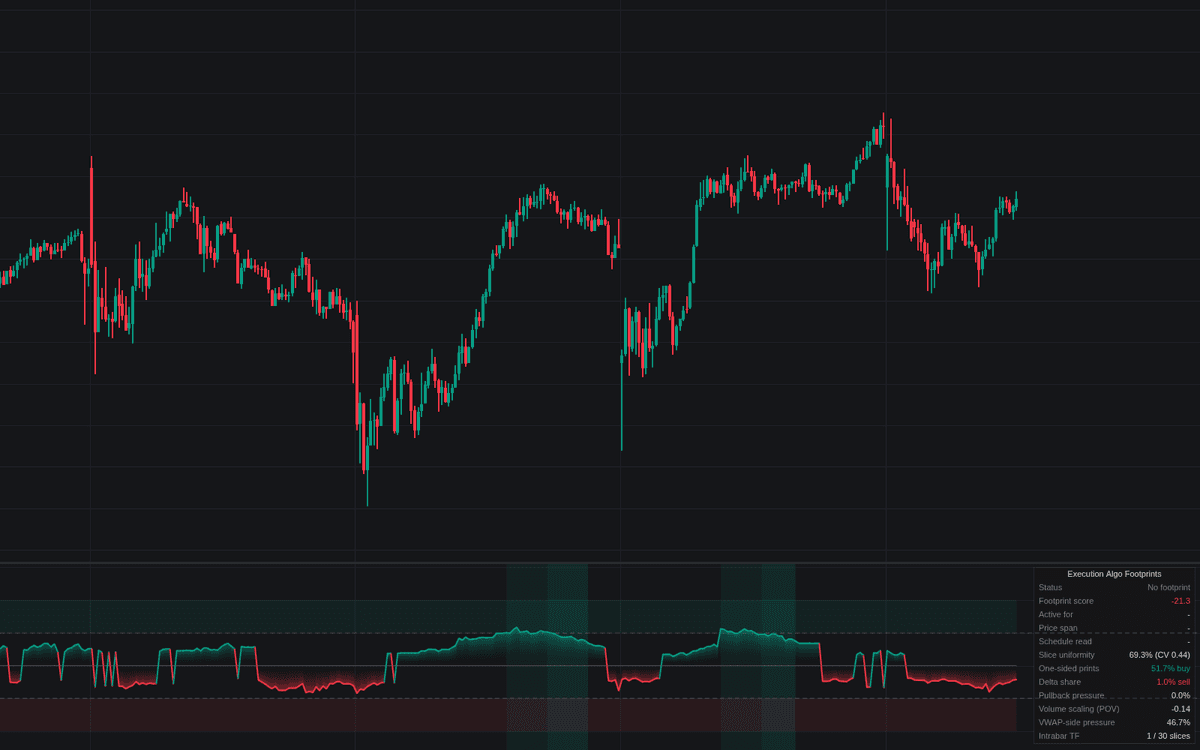

Execution Algo Footprints compresses the tape-level signature of a parent order being worked, execution algo footprints, into one signed score. Intrabar slices stand in for child-order prints; the build scores their uniformity, one-sidedness, persistence through pullbacks and volume scaling, averaging the four components into a 0-100 score signed by the dominant side. Beyond the threshold a tentative program is tracked; surviving the confirmation time across a sufficient span upgrades it to confirmed.
How to Trade the Execution Algo Footprints?
- Tentative detection: the score crossing the dashed threshold starts a footprint and lightly tints the pane, a hypothesis about persistent flow.
- Confirmed program: persistence plus span is the schedule signature; the dashboard's Schedule read labels the mix VWAP/POV-like, TWAP-like or Mixed.
- Fade / completion: the score falling below 75% of the threshold, or the side flipping, releases the footprint. The persistent support or pressure it supplied is gone.
Execution Algo Footprints Settings
- Analysis Window (bars) (default 30): window over which the four components are measured.
- Detection Threshold (default 50): composite score required to flag a working program.
- Confirmation Time (minutes) (default 60): how long a detection must persist to count as confirmed.
- Min Price Span (ATR) (default 1.0) with ATR Length (default 14): a confirmed program must have worked across price levels, unlike an iceberg defending one.
- Auto Intrabar Timeframe (default on) and Custom Intrabar Timeframe (default 1): the slice source, roughly a dozen slices per chart bar when automatic.
- VWAP Proximity (ATR) (default 0.25): band around the session VWAP where benchmark-hugging pressure is checked.
- Display: Show Dashboard and Highlight Active Program (both on).
Frequently Asked Questions

Original indicatorBuilt in-house by LuxAlgo
The Library is free. Quant makes it yours.
Pull any concept or indicator into Quant: rebuild it, retune it, or turn it into a backtested strategy of your own.