Volume Delta Candles
 By LuxAlgoApr 11, 2024
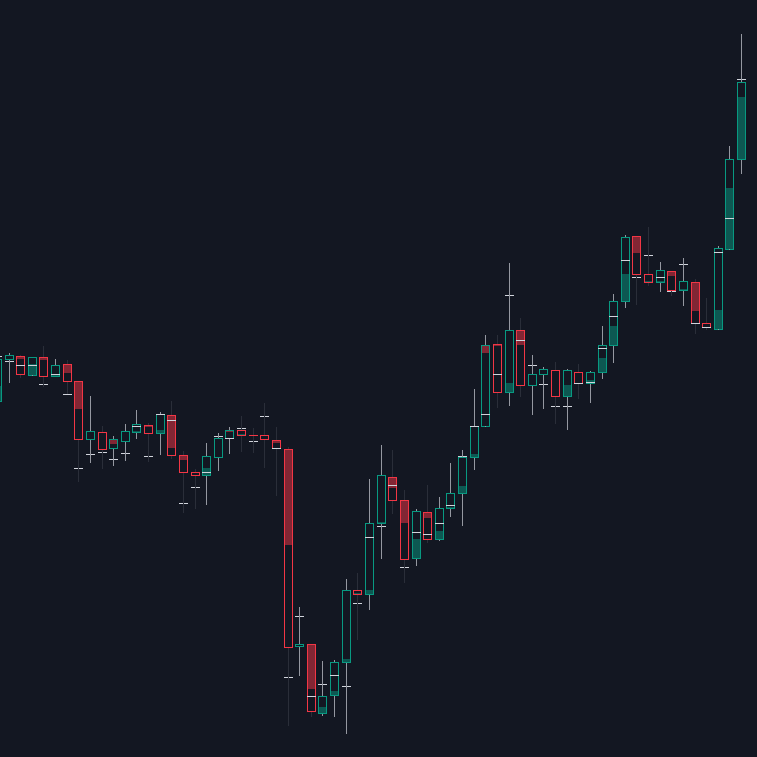
Volume Delta Candles embeds the volume delta read directly in your candles. Using lower-timeframe or real-time tick data, it measures the balance of buy and sell volume inside each bar and paints that delta as a proportional colored segment (filling upward from the base for net buying, downward from the top for net selling), while a contrasting line marks the price level where the bar's heaviest trading took place.
How to Trade the Volume Delta Candles?
- Green segment rising from the candle base: positive delta. Buyers outweighed sellers inside the bar.
- Red segment hanging from the top: negative delta, net selling pressure.
- Delta color against candle color: a red delta inside a green-bordered candle (or the reverse) means order flow disagrees with the bar's direction, a conflict worth resolving before trusting the move.
- Max-volume price line: the busiest level inside the bar; enabling the previous-bar dot shows how these levels migrate from candle to candle.
The delta can be drawn across the full bar or half of it, opposing-sentiment colors are customizable, and a dotted vertical line marks where intrabar data begins. Optional labels print volume, delta, and percentage values for exact reading.
Volume Delta Candles Settings
- Data from: lower-timeframe data or real-time tick data.
- Resolution / Auto + multiple (default 1500): intrabar precision. On a daily chart the default resolves to a one-minute lower timeframe.
- Display: colors the full bar or half of it.
- Display past max volume price: dot marking the prior bar's highest-volume level.
- Table, label, and color options control the timeframe readout and detail text.
Frequently Asked Questions
Free indicator
Get free access to this indicator on the platforms below.

The Library is free. Quant makes it yours.
Pull any concept or indicator into Quant: rebuild it, retune it, or turn it into a backtested strategy of your own.