Concept
Gator Oscillator
Gator Oscillator is a Momentum & Oscillators concept. The Library holds 1 implementation, a working definition you can pull into Quant.
Top Gator Oscillator indicator
The top custom implementation, built on the original standard Gator Oscillator formula.
1 total
The Gator Oscillator implementation below can become a backtested trading strategy — describe your rules and Quant writes the code.
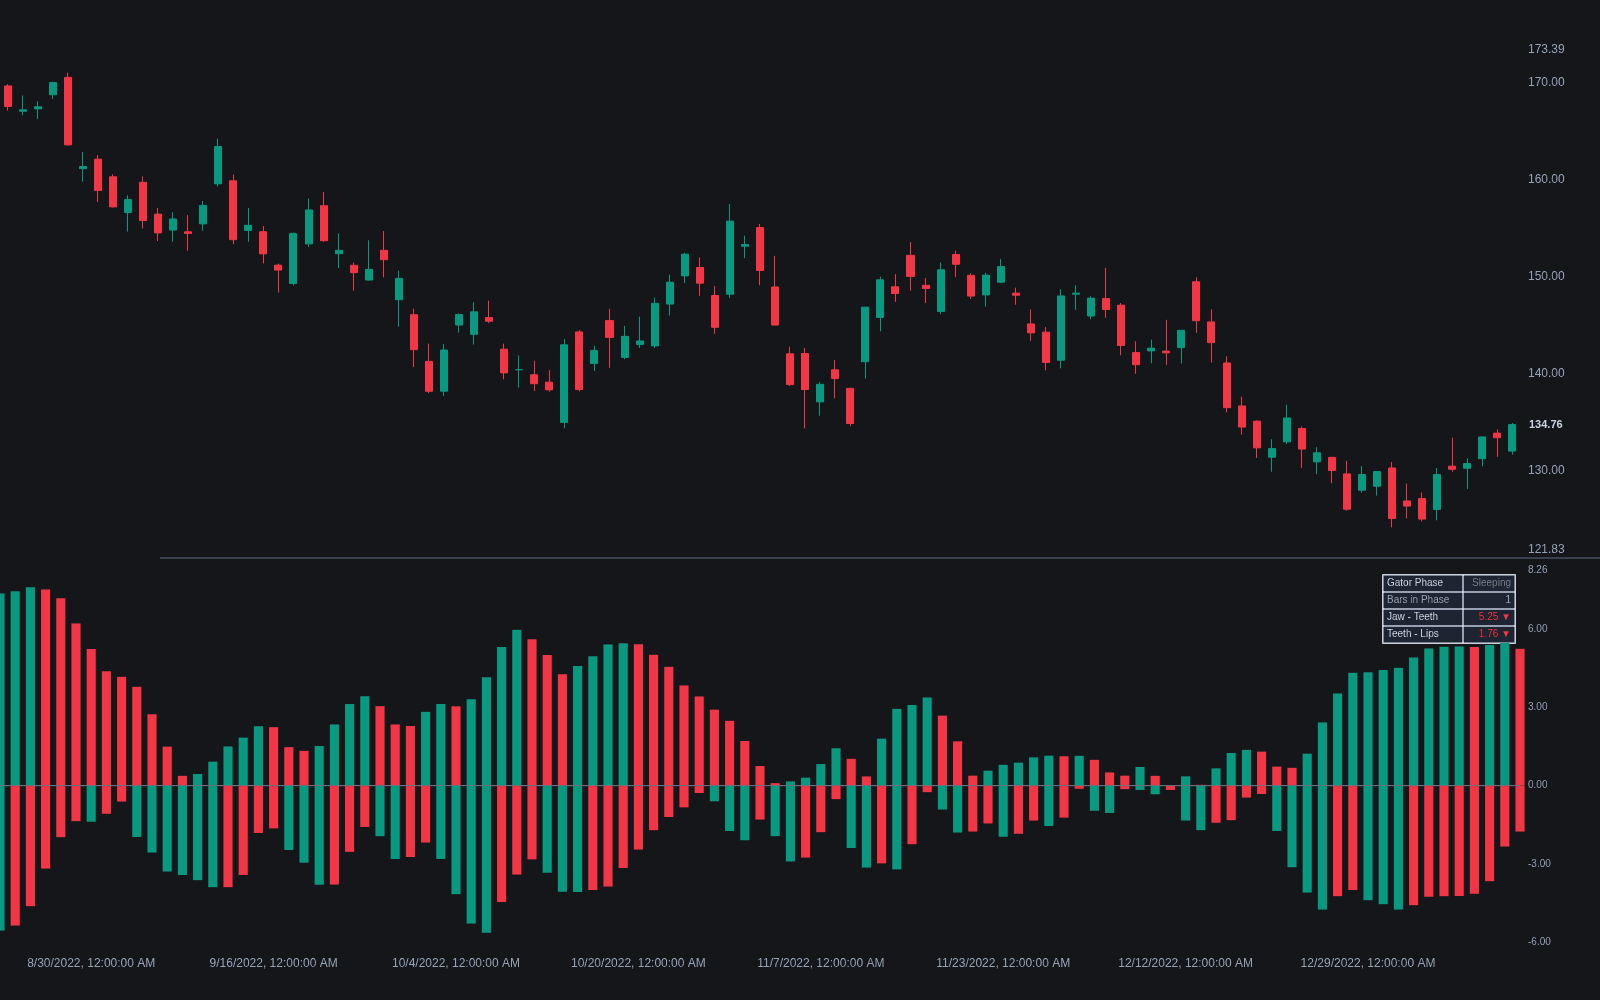
What is the Gator Oscillator?
The Gator Oscillator is Bill Williams' histogram view of his own Alligator indicator. Instead of plotting the Alligator's three smoothed moving averages (jaw, teeth, lips) on price, it plots the distances between them as two mirrored histograms around a zero line: the absolute spread between jaw and teeth above zero, and the negative absolute spread between teeth and lips below zero. Each bar is colored green when it is larger than the previous bar and red when it is smaller, so color encodes whether the averages are spreading apart or converging.
Williams framed markets as spending most of their time ranging and only a minority trending, and the Alligator's lines braid together when nothing is happening. The Gator makes that state machine explicit without reading three overlapping lines: shrinking bars on both sides mean the averages are converging and the market is quiet, expanding bars mean a trend is stretching the lines apart. Williams described the sequence with a feeding metaphor: the Gator sleeps, awakens, eats, and gets sated, and each phase has a specific two-color signature.
Reading the phases is a color exercise. Sleeping: both sides print red, typically small, bars, meaning the lines are braided and the market is ranging; Williams' method avoids new entries here. Awakening: one side turns green while the other stays red, the first sign the averages are starting to separate. Eating: both sides print green bars and the trend phase is considered fully underway. Sated: after an eating run, one side flips back to red, warning the move is losing steam and that exits or tightened stops deserve attention.
Because every input is a smoothed, forward-shifted moving average of median price, the Gator is a lagging trend-phase gauge, not a directional signal. It says nothing about whether the trend is up or down; direction has to come from price, the Alligator lines themselves, or a companion tool. Its value is timing participation: staying out while the histograms shrink, and staying with a position while both sides keep printing expanding bars.
How it's calculated
The Gator is built directly from the Alligator's three smoothed moving averages (SMMAs) of median price, each shifted forward.
Bars are colored by comparison with the previous bar on the same side: green if larger in absolute size, red if smaller.
Some platforms substitute simple or exponential averages; spreads and phases then differ slightly from the original SMMA version.
How traders use it
- As a participation filter: traders wait out the sleeping phase and only take Alligator or fractal breakout entries once the Gator is awakening or eating.
- As a trend-maturity gauge for exits: a sated print after a long eating phase is used to tighten stops or scale out rather than to reverse position.
- As a convergence warning: a long run of shrinking red bars often precedes a volatility expansion, so some traders treat deep sleep as a signal to prepare breakout orders in both directions.
- Alongside directional tools such as Awesome Oscillator or the Accelerator readings from the same toolkit, since the Gator itself is direction-blind.
- With realistic expectations: because the inputs are shifted, smoothed averages, phase changes arrive late, and in choppy markets awakening signals frequently fail back into sleep.
Gator Oscillator vs related tools
Alligator: The Alligator plots the three averages on price; the Gator plots the spreads between them as histograms. Same information, different rendering: the Gator makes convergence and expansion easier to see, the Alligator keeps the directional context.
ADX / DMI: ADX also measures trend strength without direction, but from smoothed directional movement rather than moving-average spreads, and it pairs with the DI lines for direction. The Gator has no directional component at all.
Awesome Oscillator: The Awesome Oscillator is a signed spread of two averages and therefore carries direction. The Gator uses absolute spreads, so it only grades how stretched the structure is, never which way.
Concept family
Momentum & Oscillators
91 concepts mapped · 91 in the Library
Gator Oscillator FAQ
Turn Gator Oscillator into a trading strategy.
Take the implementation from this page into Quant, then build on it, backtest it on real data, and keep refining it in conversation.