Initial Balance Breakout Signals
 By LuxAlgoSep 24, 2025
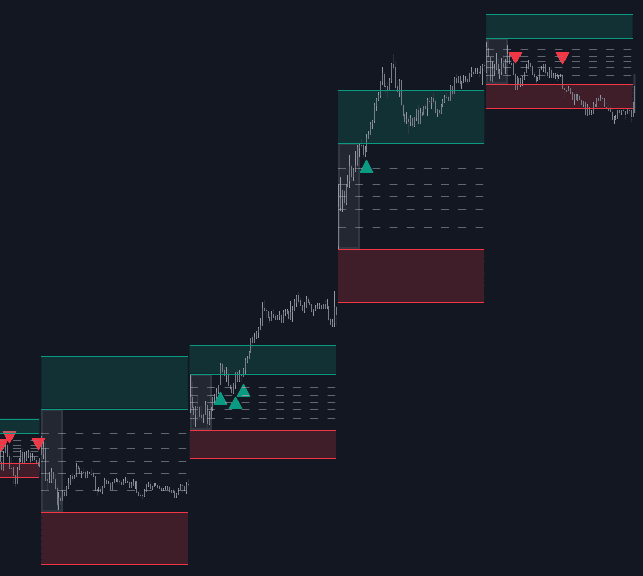
The Initial Balance Breakout Signals is a powerful trading indicator designed to help traders spot high-probability breakout opportunities based on the Initial Balance (IB) concept. This tool automatically identifies the IB range (or allows you to use custom sessions), plots dynamic breakout signals, includes configurable Fibonacci levels, and introduces a forecasting system based on historical IB behavior. Whether you're a day trader, scalper, or swing trader, this tool provides key insights into market sentiment and potential breakout directions using a time-tested methodology grounded in institutional trading logic.
How to Trade with the Initial Balance Breakout Signals Indicator
The Initial Balance (IB) is a well-known intraday trading concept that defines the high and low price levels during the first hour of the trading session. This zone is often where large institutional players execute their trades, creating a price range that reflects early market sentiment and often sets the tone for the rest of the session.
Understanding price behavior around the IB range is crucial for intraday strategies:
- Bullish sentiment: When price breaks and holds above the IB high.
- Bearish sentiment: When price breaks and holds below the IB low.
- Neutral/mixed sentiment: When price remains inside the IB range.
Key Trading Concepts
There are two primary breakout scenarios that traders can leverage:
- IB Extreme Breakout: A sustained breakout above or below the IB high or low often leads to a continuation move in that direction.
- IB Extreme Rejection: If price attempts to break out but fails, there's often a high probability that it will revert and test the opposite extreme of the IB.
The Initial Balance Breakout Signals indicator includes tools to visually and analytically assess both scenarios, making it ideal for breakout and reversal traders alike.
Custom Sessions & Breakout Signal Control
The indicator can operate in Auto mode, where it automatically detects the first hour of the regular trading session and plots breakout signals accordingly.
Alternatively, you can define custom sessions for both the IB range and breakout signals. This allows the tool to adapt seamlessly to other trading methodologies like Open Range Breakout (ORB) strategies, where the range may be defined by the first 1, 3, 5, or 30 minutes.
Use cases include:
- Open Range trading using 3-minute or 5-minute ranges
- Overnight session analysis (e.g. Asian or European sessions)
- Multi-session breakout monitoring
This flexibility turns the indicator into an all-purpose intraday range trading strategy tool, capable of adapting to different market hours and global sessions.
Initial Balance Extensions
Breakout traders often target price extensions from the IB high and low. This indicator includes a simple way to project those levels:
- Choose your extension percentage (e.g., 25%, 50%, 100%) based on the IB range
- Toggle the Top and Bottom extensions independently
- Use these as dynamic profit targets or areas of expected resistance/support
For example, setting the extension to 25 means the tool adds a quarter of the IB range beyond the high/low as a breakout target.
Fibonacci Levels for Retracement Trading
The tool includes built-in Fibonacci retracement levels applied directly to the Initial Balance range, offering:
- Customizable Fib levels and colors
- Option to reverse the levels
- Label display with adjustable font size
Fibonacci levels are especially useful for analyzing:
- Whether buyers or sellers are successfully defending IB retracement zones
- Potential entry points within the IB range
- Key decision-making levels for continuation or reversal
In the example, price holding above the 0.236 Fibonacci level indicated bullish strength and a high probability of continuation upward.
IB Forecasting Engine
Forecasting helps traders assess whether the current session is behaving in line with historical expectations. This indicator features two forecasting methods:
- IB Against Previous Open: Calculates the average distance between IB high/low and the previous day's open price.
- Filter by Current Day of Week: Compares IB range with the average IB of the same weekday (e.g., all Mondays).
Additional parameters:
- Forecast Memory: Number of past days used for the average
- Forecast Multiplier: Adjust the projection width by applying a scaling factor
- Visual Settings: Customize colors and line styles
This forecast is incredibly helpful for gauging session momentum. If the current IB is above the average, buyers are likely in control. If it's below the average, sellers may dominate.
Indicator Settings Overview
Display
- Display Last X IBs: Control how many past IBs are visible
Initial Balance & Breakouts
- Initial Balance: Choose Auto or custom session range
- Breakouts: Toggle breakout signals and define custom session if needed
Extensions
- Top Extension: Enable and set custom IB % (e.g. 25%, 50%, 100%)
- Bottom Extension: Same options as top
Fibonacci Levels
- Display Fibonacci: Toggle Fib levels on/off
- Reverse: Option to flip levels
- Levels, Colors & Style: Full customization
- Display Labels: Toggle and resize text labels
Forecast
- Display Forecast: Enable and select forecasting mode
- Forecast Memory: Choose how many days are used to calculate the average
- Forecast Multiplier: Adjust the prediction range size
- Forecast Colors & Style: Customize line visuals
Style Settings
- Initial Balance Colors: Select individual colors
- Extension Transparency: Choose transparency from 0 (solid) to 100 (invisible)
Frequently Asked Questions (FAQ)
What is the Initial Balance?
The Initial Balance is the high and low range formed during the first hour of a trading session. It serves as a key reference point for institutional traders and is used to assess market sentiment and potential breakout zones.
Can I use this indicator for Open Range Breakouts?
Yes, the indicator supports custom sessions, including short ranges like the first 1, 3, 5, or 30 minutes—making it ideal for Open Range Breakout (ORB) strategies as well.
How do I interpret the forecast feature?
If the current IB range is larger than the forecast average, it suggests strong market momentum (buyers/sellers in control). If it's smaller, the market may be consolidating or lacking direction.
Can I use this indicator for futures or forex markets?
Absolutely. The custom session support makes it perfect for overnight trading, global markets, and 24-hour instruments like futures and forex.
How can I access the Initial Balance Breakout Signals indicator?
You can get access on the LuxAlgo Library for charting platforms like TradingView, MetaTrader (MT4/MT5), and NinjaTrader for free.
Free indicator
Get free access to this indicator on the platforms below.

Unlock the entire LuxAlgo Library
Every indicator, every strategy, full charts, and complete access to Quant — our AI agent.