Value Migration
 By LuxAlgoJun 19, 2026
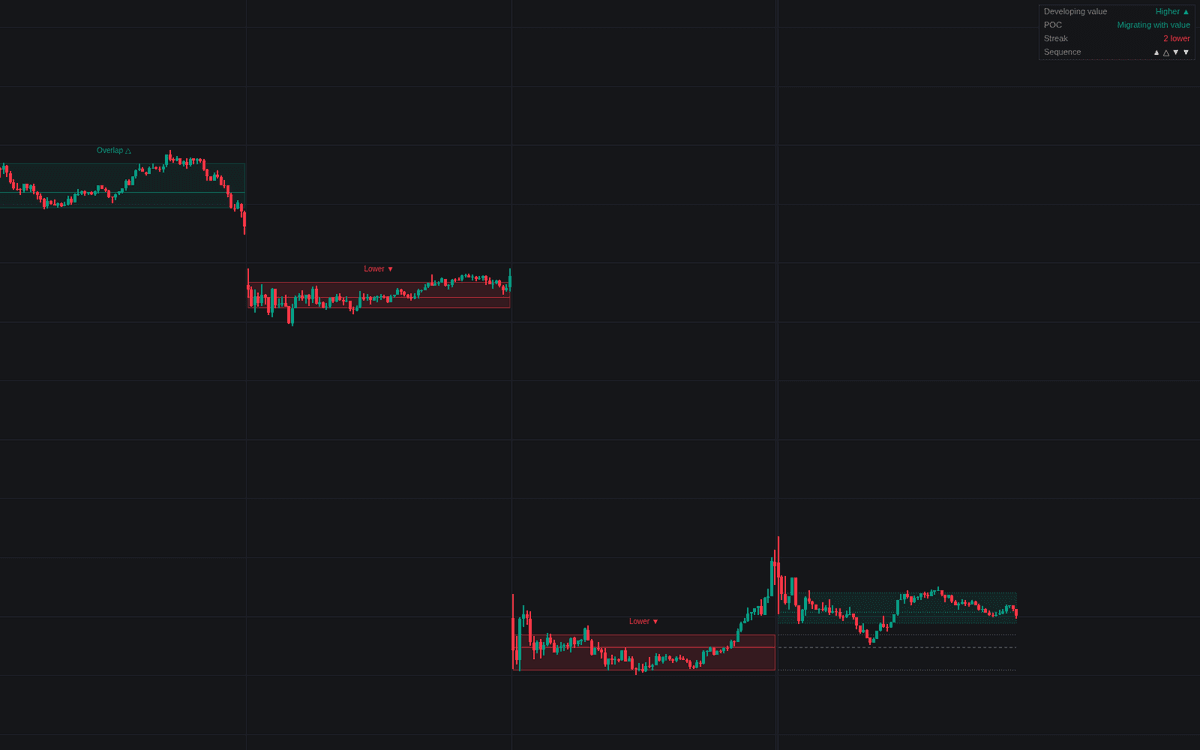

Value Migration classifies every completed session against the one before it under the overlapping value rules, turning value migration into labeled objects on the chart. Each session (daily anchor by default) is reduced to a value area and point of control, and the new area is graded against the prior one: Higher, Overlap higher, Unchanged, Overlap lower, Lower or Outside. Boxes and POC lines color by category, a dotted developing area tracks the live session against extended prior references, and a dashboard reads the streak and sequence.
How to Trade the Value Migration?
- Clean migrations: a value area built entirely above or below the prior one is the strong directional case; overlapping shifts are tentative. All six categories carry alerts.
- Streaks: consecutive same-direction migrations reaching the Trend-Grade Streak read as trend-grade acceptance, with a dedicated alert.
- Warning marks: a new price extreme while value fails to migrate that way is excursion without acceptance, flagged on the label and alerted.
Value Migration Settings
- Anchor Period (default Daily): the sessions being compared; run the chart below it.
- Profile Rows (default 25): resolution of each session profile.
- Value Area % (default 70): share of the session's business expanded around the POC.
- Profile Weighting (default Volume): volume-distributed rows or TPO (Time) counts.
- Unchanged Tolerance % (default 10): how closely both edges must match the prior area to read as unchanged.
- Trend-Grade Streak (default 3): consecutive sessions treated as trend evidence.
- Display: Session Value Areas, Session POC, Migration Labels, Developing Value Area, Prior Value References, Dashboard (all on, Top Right, Small).
Frequently Asked Questions

Original indicatorBuilt in-house by LuxAlgo
The Library is free. Quant makes it yours.
Pull any concept or indicator into Quant: rebuild it, retune it, or turn it into a backtested strategy of your own.