Profile Shape Taxonomy
 By LuxAlgoMay 22, 2026
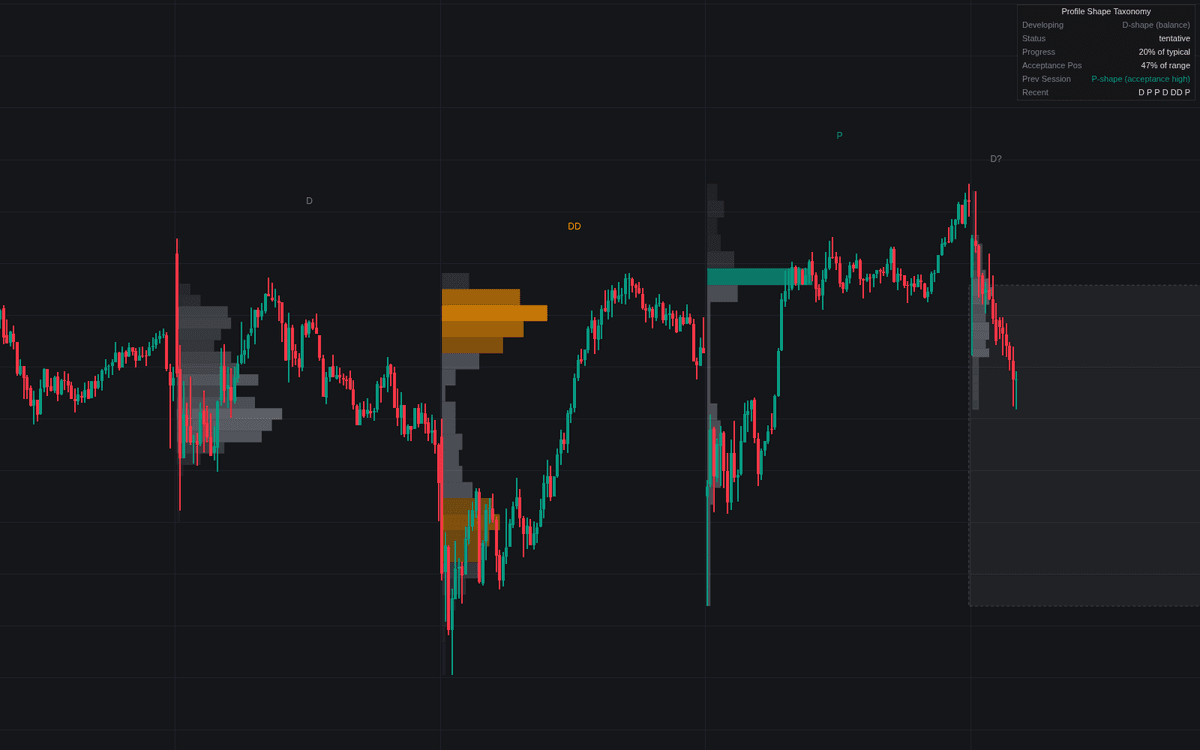

Profile Shape Taxonomy classifies each session's profile silhouette live, the first self-classifying build of the profile shape taxonomy. Bars accumulate into a row histogram, contiguous fat rows form acceptance bulges, and geometry assigns the letter: a centered bulge is a D, acceptance high over a rejected tail a P, acceptance low under one a b, and two bulges across a thin neck a double distribution. Letters carry a question mark until the session nears its typical length.
How to Trade the Profile Shape Taxonomy?
- D-shape firming up: a balanced, rotational session favoring responsive trade around value; the Recent row shows balance days stacked against a trend.
- P and b shapes: one-sided drives that found acceptance at one end. A downtrend P classically reads as short covering, an uptrend b as its mirror.
- Thin zone revisit: the rejected band a completed session leaves (a neck or P/b tail) extends right; revisits tend to move fast and are alerted.
Profile Shape Taxonomy Settings
- Profile Anchor (default Day): or Week or Month for composites.
- Profile Rows (default 25).
- Row Weighting (default Volume): or Time (TPO-style).
- Acceptance Threshold (% of POC row) (default 40): the fat-row cutoff.
- Thin Threshold (% of POC row) (default 20): the rejection cutoff.
- Upper/Lower Portion Boundary (%) (default 60): the P/b centroid boundary.
- Min Tail Span (% of range) (default 20): minimum rejected tail for a P or b.
- Min Distribution Share (%) (default 20) and Min Neck Span (% of range) (default 8): the double-distribution gates.
- Min Bars To Classify (default 10) and Firm After Session Progress (%) (default 75): maturity gates.
- Display: Developing Profile (on), Completed Profiles Shown (default 3), Extend Latest Thin Zone (on), Dashboard (on), Profile Width (% of session) (default 40).
Frequently Asked Questions

Original indicatorBuilt in-house by LuxAlgo
The Library is free. Quant makes it yours.
Pull any concept or indicator into Quant: rebuild it, retune it, or turn it into a backtested strategy of your own.