Concept
Line Break
Line Break is a Meta & Composition concept. The Library holds 1 implementation, a working definition you can pull into Quant.
3LB
Top Line Break indicator
The top custom implementation, built on the original standard Line Break formula.
1 total
Want to trade Line Break? The implementation below is one prompt away from a backtested strategy in Quant.
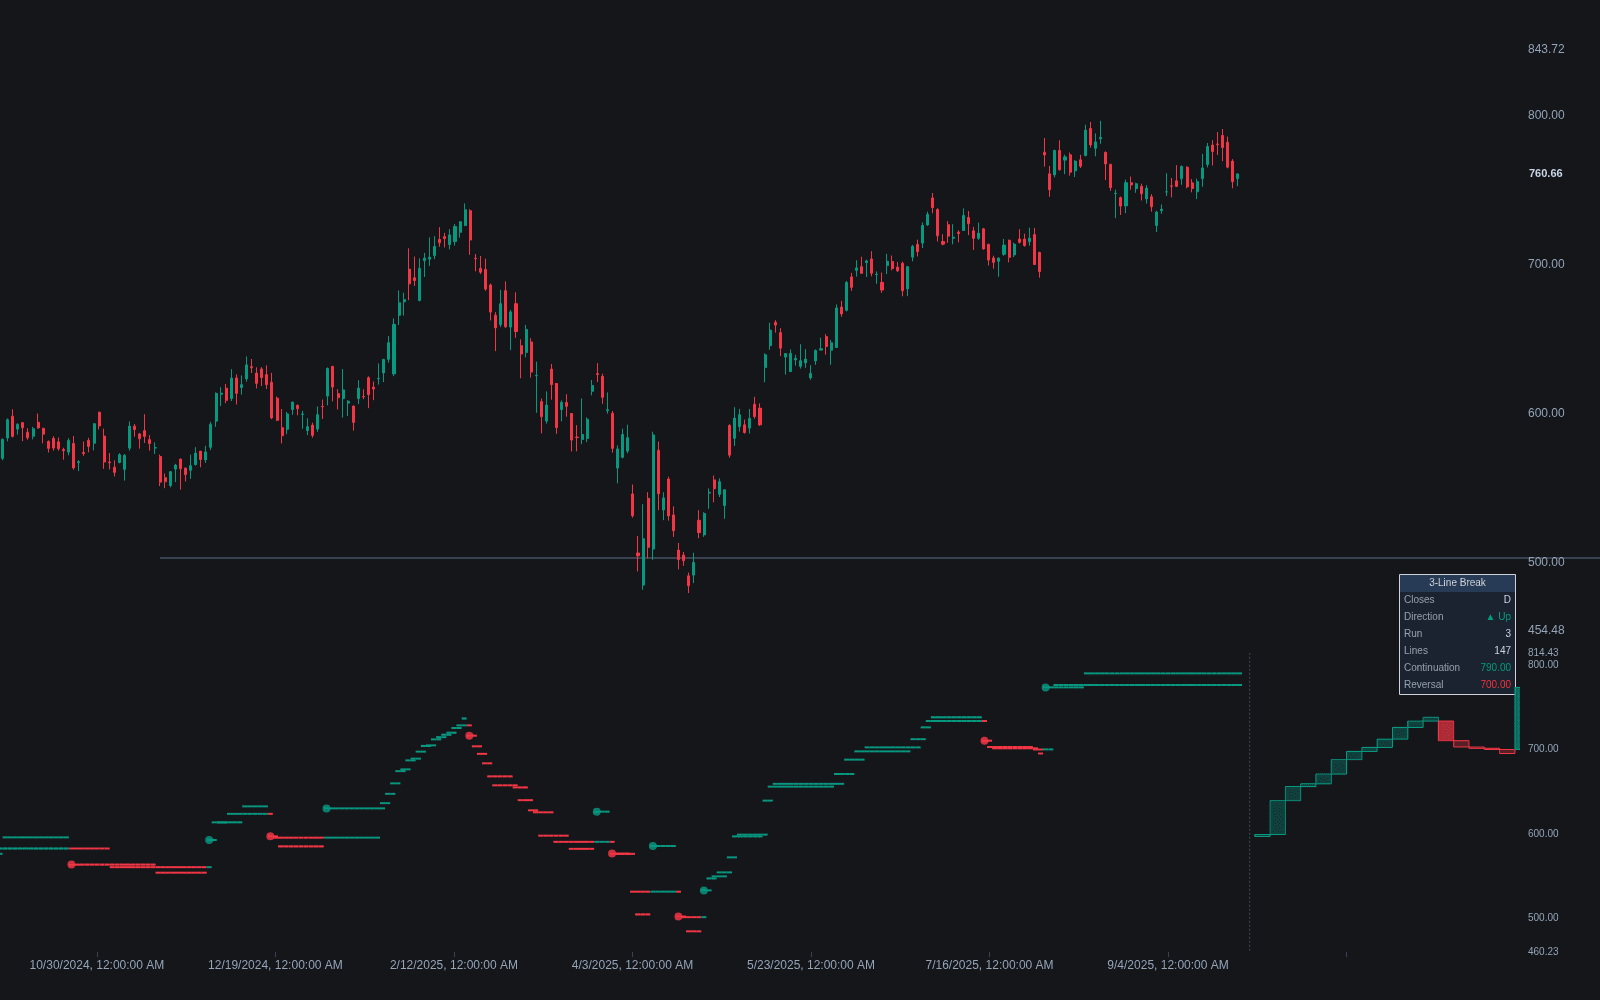
What is a Line Break Chart?
A line break chart is a Japanese time-independent chart built entirely from closing prices. A new up line is drawn when the close exceeds the high of the previous line, a new down line when the close falls below the previous line's low, and nothing is drawn at all when the close stays inside the prior line's range. The most common configuration looks back three lines, hence the usual names three-line break, or simply 3LB.
The three-line lookback is what creates the chart's asymmetric filter: continuation requires only a new close beyond the last line, but reversal requires the close to exceed the extreme of the previous three lines. A trend in progress therefore keeps printing lines on modest progress, while turning the chart around demands a move large enough to erase three lines of prior progress. This makes line break charts naturally trend-following in character: established runs persist, and reversals, when they finally print, represent substantial closes against the trend.
Unlike Kagi or Renko, line break charts need no user-chosen reversal amount. The filter is self-scaling, derived from the size of recent lines themselves, which practitioners count as the format's main attraction: one integer parameter (the line count) instead of a box or reversal size that must be re-tuned per instrument and regime. The trade-off is the usual one for close-only transforms: intraline volatility, wicks, and time information are all discarded.
How to read a line break chart
Line break charts are read from line color sequence and the size of reversal lines.
- 1Confirm the settings: the number of lines used for reversals (three is standard; two is more sensitive, and some traders use higher counts for slower charts) and the timeframe of the closes feeding the chart.
- 2Read the current run: consecutive up lines mark an uptrend by construction, since each required a close above the prior line's high. No line printing means price is drifting inside the previous line's range.
- 3Identify reversal lines: a down line appearing after a series of up lines means the close broke below the low of the prior three lines. These turnaround lines are the chart's principal signal and are typically longer than continuation lines.
- 4Gauge trend maturity by line count: long unbroken sequences of same-color lines show persistent trends, and some practitioners grow cautious after extended runs, treating late continuation lines as increasingly fragile.
- 5Cross-check levels on a standard chart: because line break discards time and intraline extremes, most users verify breakout levels and context on a candlestick chart before acting.
How traders use it
- As a trend filter: the color of the current line gives an unambiguous, close-confirmed trend state that can gate signals from other tools, a role similar to a higher-timeframe trend filter but derived from price structure rather than a moving average.
- Trading the turnaround line: the classic approach enters in the direction of a fresh reversal line, on the logic that erasing three lines of progress signals genuine directional change rather than noise.
- For cleaner swing mapping: sequences of lines compress choppy periods into nothing, which makes larger swing structure easier to see on instruments that chop heavily on time-based charts.
- As an exit mechanism: some trend followers hold positions until the chart prints a reversal line, accepting a late exit in exchange for reduced sensitivity to intratrend shakeouts that stay short of the reversal threshold.
- Honest limitation: reversal signals are structurally late, since price must retrace the full span of the prior lines before anything prints, and in whipsaw conditions alternating reversal lines can generate consecutive losing signals.
Line Break vs related chart transforms
Renko: Renko quantizes movement into fixed-size bricks set by the user. Line break lines have variable sizes determined by closes, and the reversal filter scales itself from recent lines rather than from a chosen brick size.
Kagi: Kagi turns on a user-defined reversal amount and signals through line thickness at prior extremes. Line break turns on closes breaking the extreme of the prior n lines, needing no amount parameter.
Point & Figure: Point and figure uses box size plus a reversal count and supports its own target-counting methods. Line break is simpler: close-only, no boxes, and its signals are limited to line color changes.
Heikin-Ashi: Heikin-Ashi keeps the time axis and smooths each candle by averaging. Line break abandons time entirely and adds lines only on new extremes of closes, so it filters by construction rather than by averaging.
Concept family
Meta & Composition
28 concepts mapped · 28 in the Library
Line Break FAQ
Turn Line Break into a trading strategy.
Take the implementation from this page into Quant, then build on it, backtest it on real data, and keep refining it in conversation.