Momentum Expansion vs Contraction
 By LuxAlgoMay 18, 2026
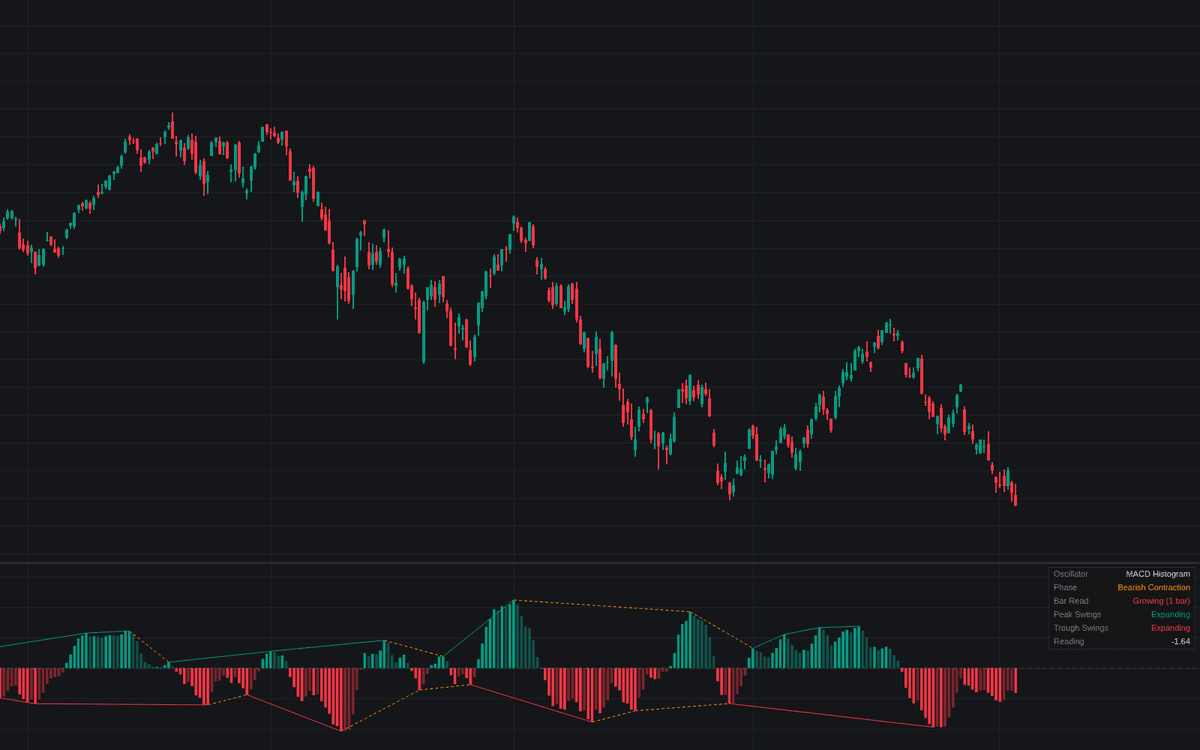

Momentum Expansion vs Contraction reads the grammar of momentum expansion vs contraction on the oscillator of your choice: MACD histogram by default, or Momentum, Rate of Change, RSI, Stochastic %K or CCI, re-centered into one zero-based histogram. Bar-to-bar, a growing or shrinking streak must sustain for 3 confirmation bars before a phase is called; swing-to-swing, successive 5-bar peaks and troughs are compared and connected.
How to Trade the Momentum Expansion vs Contraction?
- Full-color columns: each reading stretches further from zero than the last: the move is accelerating.
- Faded columns: readings shrinking back toward zero: deceleration; a warning, not a signal.
- Dashed connectors: the latest momentum peak or trough fell short of the prior one; repeated shortfalls against fresh price extremes are the raw material of divergence.
- Phase confirmations: expansion and contraction alerts fire only after the full confirmation window.
Neither read predicts on its own. The pane grades the move already under way.
Momentum Expansion vs Contraction Settings
- Oscillator (default MACD Histogram): the tool the grammar is read on; RSI and Stochastic %K plot as distance from 50.
- Source (default close).
- MACD Fast / Slow / Signal (defaults 12 / 26 / 9): the histogram engine.
- Oscillator Length (default 14): lookback for the non-MACD options.
- Confirmation Bars (default 3): consecutive growing or shrinking bars needed to call a phase; a zero-line side change resets the count.
- Swing Detection Length (default 5): pivot strength of the swing read.
- Bar Coloring (default Bar-to-bar): each column painted by its own read, or Confirmed Phase for one color per phase.
- Display toggles: Swing Connectors (on), Phase Markers (off), Show Dashboard (on).
Frequently Asked Questions

Original indicatorBuilt in-house by LuxAlgo
The Library is free. Quant makes it yours.
Pull any concept or indicator into Quant: rebuild it, retune it, or turn it into a backtested strategy of your own.