Concept
Momentum Expansion vs Contraction
Momentum Expansion vs Contraction is a Momentum & Oscillators concept. The Library holds 1 implementation, a working definition you can pull into Quant.
Top Momentum Expansion vs Contraction indicator
The top custom implementation, built on the original standard Momentum Expansion vs Contraction formula.
1 total
This Momentum Expansion vs Contraction implementation is strategy-ready: open it in Quant, set your rules, and it backtests automatically.
What is Momentum Expansion vs Contraction?
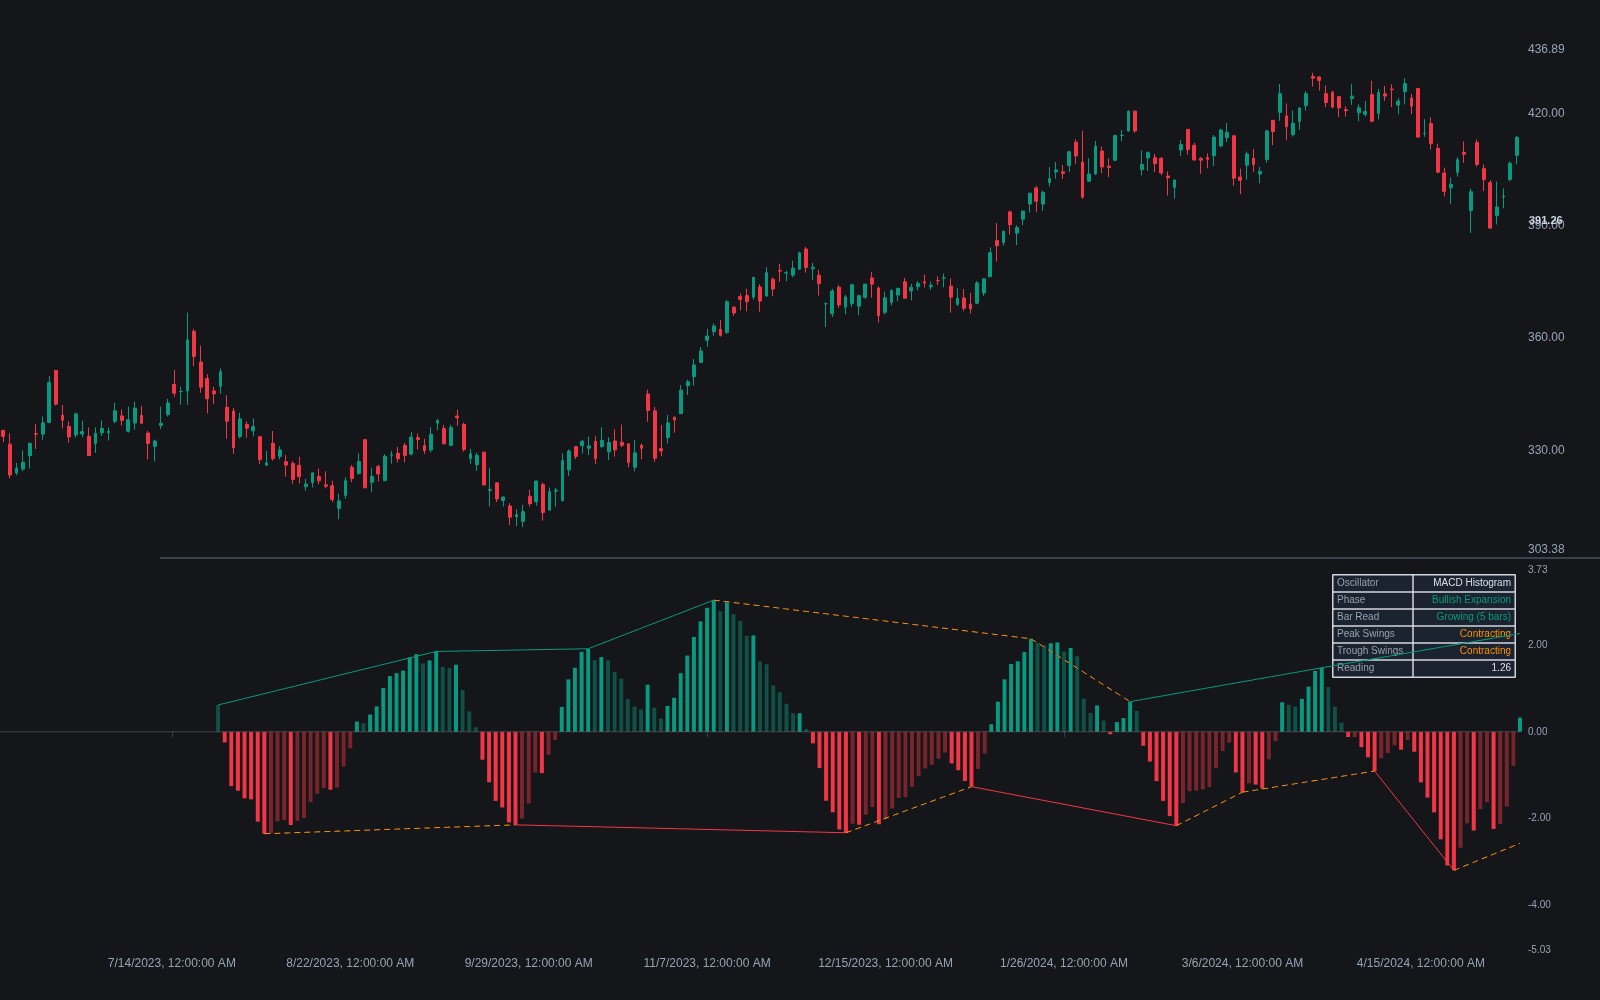
Momentum expansion vs contraction is the grammar layer of oscillator reading: is the momentum reading growing or shrinking as the move develops? Expansion means each new reading extends beyond the last, a rising MACD histogram or an oscillator pushing deeper in the direction of travel: the move is accelerating. Contraction means readings roll over and shrink back toward the zero line even while price keeps trending: the move is decelerating. The distinction matters because deceleration typically shows up in momentum before it shows up in price.
Measuring it is straightforward on any oscillator pane. On a histogram-style tool the read is bar-to-bar: bars growing away from the zero line mean expansion, bars shrinking toward it mean contraction. On line oscillators such as RSI or the stochastic, the read is swing-to-swing: successive momentum peaks reaching further in the trend's direction signal expansion, peaks falling short signal contraction. Underneath sits the derivative chain: price is position, momentum and ROC measure its velocity, and expansion versus contraction reads the acceleration, which is why the change tends to appear in the pane before the price chart bends.
Contraction is a warning, not a signal. Trends routinely pause, contract, and expand again in the same direction, so a fading histogram can resolve as consolidation rather than reversal. Most oscillator playbooks therefore treat contraction as a cue to tighten risk or demand confirming structure, and treat regular divergence, where price extends across swings while momentum contracts, as the stronger form of the same evidence.
The idea is old technical-analysis doctrine, usually compressed into the maxim that momentum peaks before price. That lead is a tendency, not a law: momentum also flattens whenever a trend merely settles into a steady grind, since constant velocity reads as zero acceleration. The grammar also has a continuation side: hidden divergence is expansion logic applied to pullbacks, where momentum holding firm while price dips marks trend health, and pinned overbought readings during an expansion phase are evidence of strength rather than an automatic fade.
How to identify momentum expansion and contraction on a chart
The read works on any oscillator, but a histogram makes it visual.
- 1Add a histogram-style momentum tool beneath price; the MACD histogram is the standard choice, and a volume-weighted MACD adds participation to the same read.
- 2Mark expansion: each bar prints taller than the last in the direction of the move, or the oscillator drives to a deeper extreme than its prior swing.
- 3Mark contraction: bars shrink back toward the zero line, or the oscillator's swings top out at shallower levels while price keeps trending.
- 4Judge swing to swing, not tick to tick: one shorter bar is noise, while several consecutive shrinking bars, or a lesser momentum peak at a new price extreme, is the real signal.
- 5Add context: contraction into a known level or after an extended run carries more warning than contraction in the middle of a range.
How traders use it
- As a continuation filter: trend-direction entries are taken while histogram bars or oscillator swings keep expanding, and skipped or downsized once readings have contracted for several bars.
- As an exit-management cue: momentum contracting against an open position, particularly into a known level, argues for trailing stops tighter before price itself confirms weakness.
- As the raw material for higher-order reads: repeated contraction across successive swings while price makes new extremes defines divergence, and a fresh expansion off a momentum reset marks a new impulse.
- As breakout quality control: a range break accompanied by expanding momentum reads as initiative and worth following, while a break on contracting readings flags a probable failure or a move to fade back into the range.
- Transposed across tools: the same grammar runs on the stochastic momentum index or CCI, with faster settings giving earlier but noisier deceleration warnings and slower settings cleaner but later ones; the read transfers because it depends on shape, not on the specific oscillator.
Momentum expansion/contraction vs related momentum reads
Regular Bullish/bearish Divergence: Contraction is the raw deceleration read, visible bar by bar; regular divergence is its formalized swing-level version, requiring price to print a new extreme while momentum prints a lesser one. Every regular divergence contains contraction, but most contractions never mature into divergence.
Overbought/oversold: Overbought/oversold reads the oscillator's level; expansion/contraction reads its direction of change. The two cross-cut: an overbought reading during fresh expansion is strength, while the same level reached on contracting swings is where fade logic earns its keep.
Momentum: Momentum is a specific indicator, price minus price N bars ago. Expansion versus contraction is not an indicator at all but a way of reading any momentum tool, including that one; it asks whether the readings themselves are growing or shrinking as the move develops.
Concept family
Momentum & Oscillators
91 concepts mapped · 91 in the Library
Momentum Expansion vs Contraction FAQ
Turn Momentum Expansion vs Contraction into a trading strategy.
Take the implementation from this page into Quant, then build on it, backtest it on real data, and keep refining it in conversation.