O'Neil Base Analysis
 By LuxAlgoJun 17, 2026
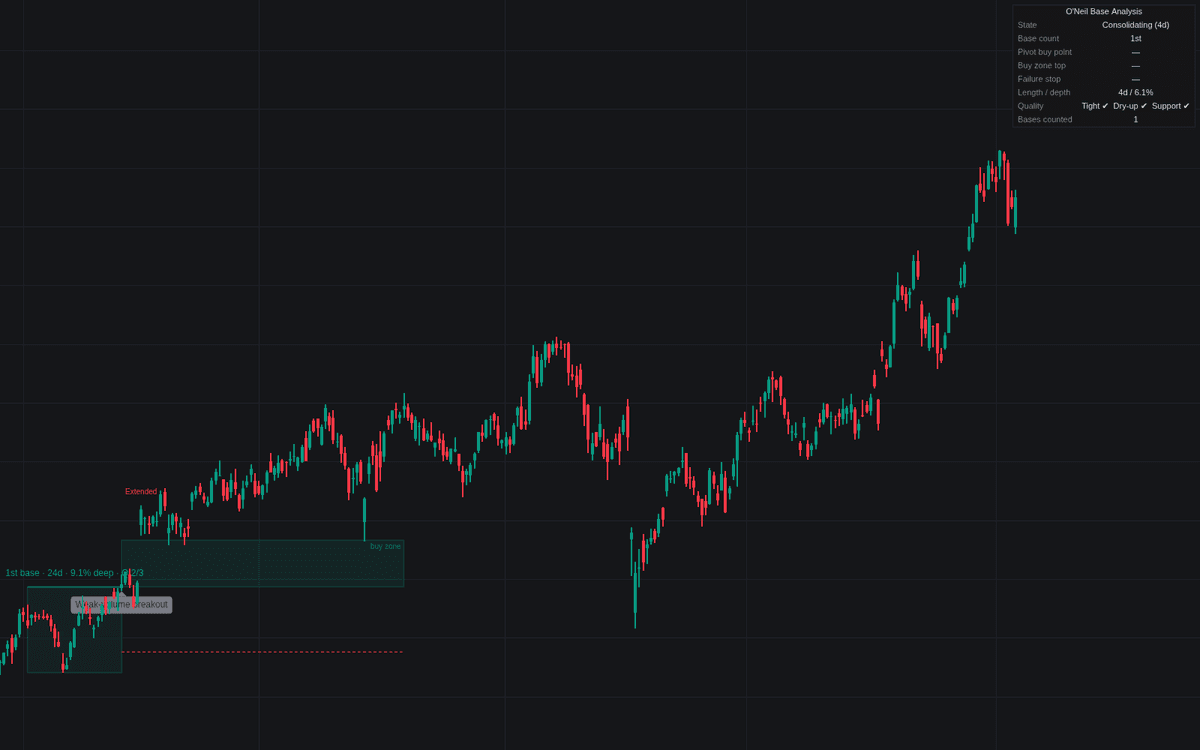

O'Neil Base Analysis runs the base life cycle of O'Neil base analysis shape-agnostically. A candidate anchors at a high and matures once it passes the prior-uptrend, length and depth checks, waiting with a dotted live pivot line. A closing breakout draws the base box, grades quality, stamps the stage label and opens the failure watch, buy zone and stop line drawn.
How to Trade the O'Neil Base Analysis?
- Pivot buy vs weak-volume breakout: a close through the pivot on volume at least the surge above average is confirmed; without it, alerted as unconfirmed.
- Buy zone discipline: entries belong in the narrow zone above the pivot: beyond it prints Extended; a heavy-volume close back inside the base is the early warning.
- Base failure: a drop to the stop below the buy point is an automatic sale under the fixed loss rule: no debate.
- Base count: a pivot forming sufficiently above the prior one advances the stage; late stages turn labels cautionary, and a decline below the prior base's low resets the count.
O'Neil Base Analysis Settings
- Prior Uptrend Minimum % (default 30) and Uptrend Lookback (bars) (default 40): the prerequisite advance.
- Minimum Base Length (bars) (default 5) and Maximum Base Depth % (default 33): what counts as a base rather than a correction.
- Pivot Margin Above Resistance % (default 0.1), Buy Zone Above Pivot % (default 5) and Base-Failure Stop % (default 7): entry and loss geometry.
- Volume Average Length (default 10) and Breakout Volume Surge % (default 40): breakout confirmation; Breakout Resolution Gain % (default 20) ends the failure watch.
- Stage Increment Threshold % (default 20) and Late-Stage Threshold (default 3): base counting.
- Tight Closes: Max Average Change % (default 4) and Volume Dry-Up Window (bars) (default 5): quality grading, plus display toggles.
Frequently Asked Questions

Original indicatorBuilt in-house by LuxAlgo
The Library is free. Quant makes it yours.
Pull any concept or indicator into Quant: rebuild it, retune it, or turn it into a backtested strategy of your own.