Concept
O'Neil Base Analysis
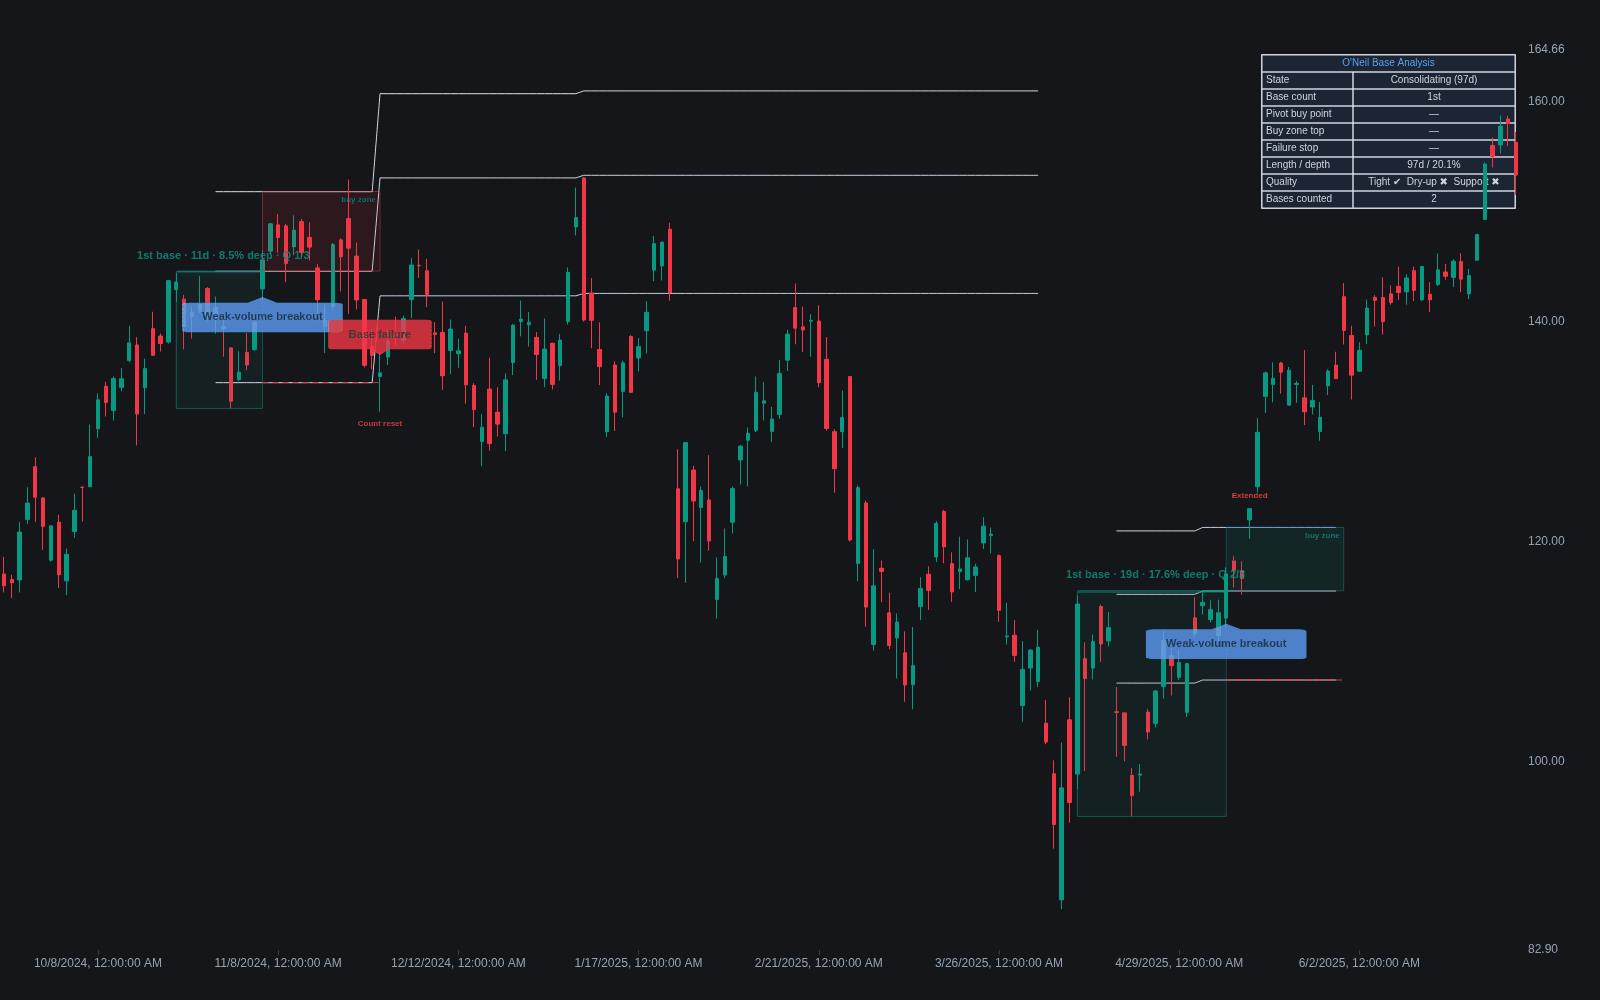
O'Neil Base Analysis, also known as base count/stages, pivot buy point, base failure, are Chart & Candlestick Patterns concepts. The Library holds 1 implementation, a working definition you can pull into Quant.
Top O'Neil Base Analysis indicator
The top custom implementation, built on the original standard O'Neil Base Analysis formula.
1 total
The O'Neil Base Analysis implementation below can become a backtested trading strategy — describe your rules and Quant writes the code.
What is O'Neil base analysis?
O'Neil base analysis is the chart-reading half of William O'Neil's growth-stock methodology, developed from his historical studies of leading stocks and taught through Investor's Business Daily and How to Make Money in Stocks. It holds that big winners launch their advances from recognizable consolidations called bases, and it supplies both a taxonomy of valid shapes and the rules for trading them: where the pivot buy point sits, what volume must do, and how base counting tracks how far an advance has progressed.
The taxonomy's main members are the cup-with-handle base, the double-bottom base, the flat base, the ascending base, the IPO base, and the rare high tight flag. Each carries minimum durations, depth limits, and volume expectations distilled from past leaders. The unifying entry concept is the pivot buy point: a precise price a small margin above the structure's resistance, bought only as price moves through it on volume well above average, with a narrow buy zone above the pivot beyond which the entry is considered chased.
Base count, sometimes called base stages, adds a life-cycle dimension. The first base after a major low is stage one; each subsequent base that forms at least about 20 percent above the prior one increments the count, and a decline below a prior base's low resets it. IBD's studies found that later-stage bases, roughly the third and beyond, fail more often because the story is widely known by then. Base failure completes the framework: a breakout that reverses and falls a fixed 7 to 8 percent below the buy point is sold without debate, the methodology's signature loss rule.
How to analyze a base O'Neil-style
The analysis is a checklist applied on weekly charts, not freeform pattern spotting.
- 1Confirm the prerequisite uptrend, conventionally a prior advance of roughly 30 percent, since bases are continuation structures, not bottoms.
- 2Classify the shape against the taxonomy and check its minimums: length in weeks, depth in percent, and structural details like handle position or an undercut second low.
- 3Grade the character: tight weekly closes, volume dry-up in the quiet portions, and supportive volume on rallies mark accumulation; wide, loose action marks distribution.
- 4Locate the pivot buy point and define the buy zone above it in advance.
- 5Count the base's stage relative to the advance's history and downgrade late-stage structures.
- 6On the breakout attempt, require volume around 40 percent or more above average, and predefine the failure exit 7 to 8 percent below the buy point.
How traders use it
- Systematic entry timing: the pivot-plus-volume rule converts pattern recognition into a concrete trigger, replacing anticipation with breakout confirmation and a bounded buy zone.
- Campaign management: base counting tells a holder where an advance likely stands in its life cycle, supporting adds from early-stage bases and profit-taking or tighter risk on later-stage ones.
- Uniform loss control: the 7 to 8 percent maximum loss below any buy point standardizes risk across all base types, on the logic that properly bought breakouts from sound bases should not retreat that far.
- Quality filtering: combining base analysis with a rising relative strength line and a healthy general market, per the broader CAN SLIM approach, screens out technically valid bases in fundamentally weak names.
- With limits: the rules are distilled from historical winners and carry survivorship bias, breakout failure rates rise materially in weak markets, and the framework's popularity means obvious pivots attract shakeouts.
O'Neil base analysis vs. related frameworks
Volatility Contraction Pattern: Mark Minervini's VCP generalizes the same compression logic into successive tightening contractions without O'Neil's named shapes; the two frameworks share lineage and often mark the same charts.
Cup and Handle: The classical cup and handle is a standalone pattern; base analysis embeds that shape in a larger system of stage counting, volume rules, and fixed loss limits.
Wyckoff Method: Wyckoff reads accumulation through the intent of composite operators and phase logic; O'Neil reaches similar conclusions through measured pattern specifications and historical precedent studies.
Concept family
Chart & Candlestick Patterns
84 concepts mapped · 84 in the Library
O'Neil Base Analysis FAQ
Turn O'Neil Base Analysis into a trading strategy.
Take the implementation from this page into Quant, then build on it, backtest it on real data, and keep refining it in conversation.