Oscillator Swing Failure
 By LuxAlgoMay 24, 2026
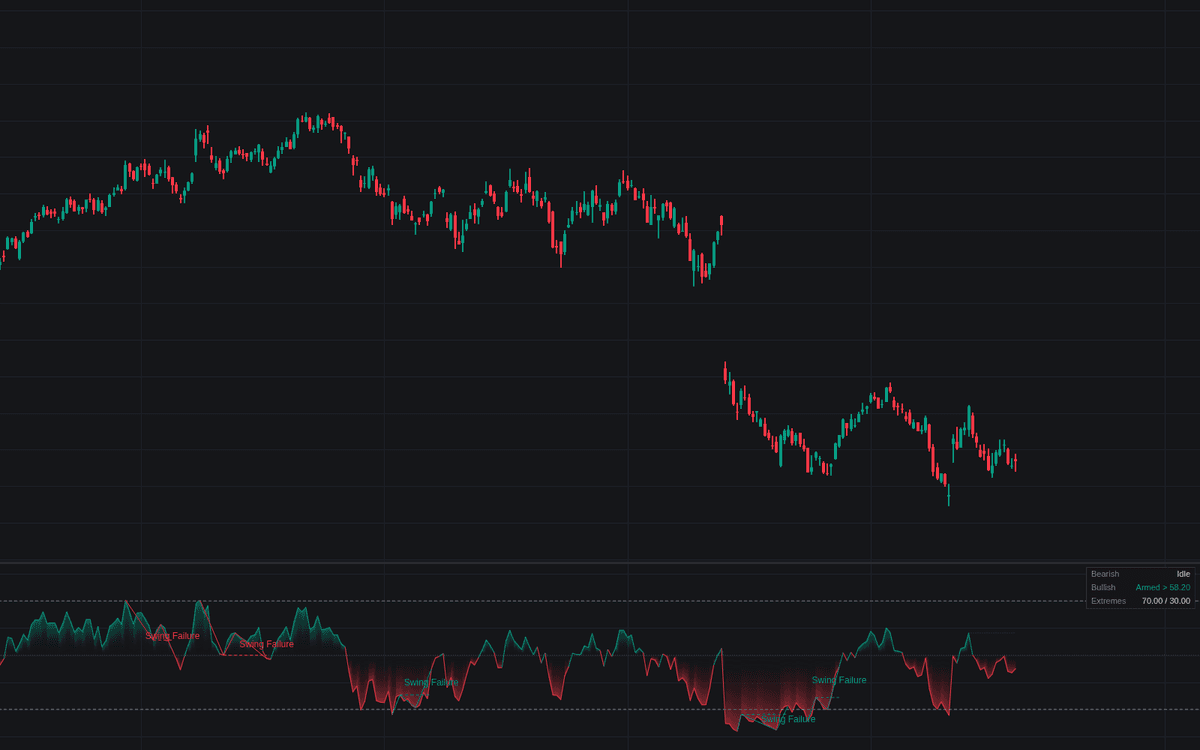

Oscillator Swing Failure brings Wilder's failure-swing template to the chart as a strict state machine, the first faithful build of the oscillator swing failure in the library. A pivot inside the extreme zone seeds the pattern, the pullback between swings fixes the fail point, a lower high (or higher low from oversold) arms it, and the signal fires when the oscillator breaks that fail point. Everything happens on the indicator itself: no price pivots involved.
How to Trade the Oscillator Swing Failure?
- Armed: a dotted watch line marks the fail point and the dashboard shows its value; a break of that level is the trigger, with "Armed" alerts on both sides.
- Swing Failure label: the fail point broke. The completed structure draws extreme, fail point and retest; its tooltip reports depth and speed.
- Extreme Set: the first extreme pivot printed; the build is waiting for the retest swing.
Oscillator Swing Failure Settings
- Oscillator (default RSI): the line the pattern is detected on. Stochastic, CCI and MFI are the alternatives.
- Source (default close) and Length (default 14); %K Smoothing (default 3) applies to the Stochastic only.
- Swing Pivot Length (default 3): bars each side an oscillator swing must dominate; small values catch tight, fast failures.
- Max Pattern Duration (default 40): bar budget from extreme to break.
- Retest Inside Threshold (default off): keeps the retest swing out of the extreme zone.
- Thresholds (default Auto), or Custom Overbought (default 70) and Custom Oversold (default 30).
- Signals (default Both): restricts detection to one side, useful in strong trends where countertrend failures repeat; dashboard and display toggles are on by default.
Frequently Asked Questions

Original indicatorBuilt in-house by LuxAlgo
The Library is free. Quant makes it yours.
Pull any concept or indicator into Quant: rebuild it, retune it, or turn it into a backtested strategy of your own.