All indicators

Peak Trading Activity Graphs

By LuxAlgoJan 28, 2026

Static chart image
Time BasedCycleDashboardLiquidityVolatility

The Peak Trading Activity Graphs is a multi-dimensional trading indicator designed to help traders instantly identify when markets experience the highest and lowest levels of volume and volatility. By aggregating historical market data into intuitive visual graphs, this trading indicator allows traders to understand when participation and price movement are most active across different time cycles. By default, the indicator plots median values, providing a statistically robust view of market behavior that filters out noise and extreme outliers. An optional Median Delta mode further enhances this analysis by highlighting relative differences between periods, making high-activity and low-activity sessions stand out clearly.

This trading indicator is highly customizable, supporting adjustable graph size, layout, and gradient color schemes. It can display up to four graphs simultaneously, with up to 16 unique configurations, making it a powerful analytical and planning tool for discretionary traders, systematic traders, and anyone refining a time-based trading strategy.

How to Trade the Peak Trading Activity Graphs?

indicator image The Peak Trading Activity Graphs is designed to be both simple to use and deeply informative. Through three primary settings, traders can select the type of market data, the time segmentation, and whether to analyze raw medians or relative differences.

There are two core data types:

  • Volume – measures market participation and liquidity.
  • Volatility – measures the magnitude of price movement.

There are four time-based perspectives:

  • Month
  • Day of Month
  • Day of Week
  • Hour of Day

For each perspective, traders can analyze either:

  • Raw median values, or
  • Median Delta, which normalizes differences to clearly show relative highs and lows.

Understanding when markets are most active is critical for execution quality, risk management, and strategy selection. This trading indicator helps traders avoid low-liquidity conditions, identify high-volatility windows, and optimize position sizing based on historically active periods.

Monthly Trading Activity

indicator image This view displays monthly median volume and volatility, with raw medians shown at the top and Median Delta values displayed below.

In the example shown, NQ volume remains relatively consistent throughout the year, with January, March, and October showing the highest participation, while December records the lowest. The delta view makes these differences immediately visible.

Volatility follows a similar distribution, with October standing out as the most volatile month and March as the least volatile. Traders can use this information to favor exposure during historically active months or reduce risk during quieter periods.

Trading Activity by Day of Month

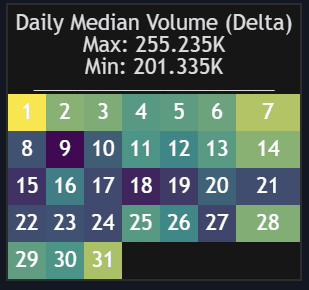
indicator image When viewing Days of Month, the indicator presents a calendar-style heatmap showing how volume and volatility change throughout the month.

Raw median values often appear evenly distributed, but enabling the Median Delta reveals subtle yet important differences between high-activity and low-activity days. This insight allows traders to anticipate liquidity expansions or contractions tied to recurring calendar effects and adjust trade frequency or aggressiveness accordingly.

Trading Activity by Day of Week

indicator image This perspective breaks down trading activity by weekday. In the BTC example shown, weekend volume differs noticeably from weekdays, while volatility remains relatively stable.

This makes the indicator particularly useful for distinguishing:

  • High-participation, trend-friendly sessions
  • Low-activity periods better suited for range or mean-reversion strategies

Traders can align their trading strategy to the dominant participation profile of each day.

Trading Activity by Hour of Day

indicator image This view highlights intraday trading behavior by hour. In the gold futures example, both volume and volatility peak during the hours surrounding the RTH open (8:00–10:00 exchange time).

This allows traders to:

  • Focus execution during high-liquidity hours
  • Avoid low-activity sessions prone to slippage
  • Optimize scalping, day trading, or breakout strategies based on historical intraday behavior

Multi-Asset Trading Activity Comparison

indicator image The Peak Trading Activity Graphs also supports cross-asset comparison, enabling traders to analyze how different markets behave over the same time periods.

indicator image With Median Delta enabled, differences become immediately apparent. In the example shown:

  • 10Y Notes and JPY show strong activity from 7:00–9:00 and 14:00–21:00
  • Silver peaks from 8:00–10:00
  • S&P 500 shows strong movement from 8:00–9:00 and 14:00–15:00

All times are displayed in exchange time. This feature is especially useful for traders who rotate between markets or design time-based trading strategies across asset classes.

Customizing Graph Size & Appearance

indicator image Traders can fully customize the visual layout by adjusting:

  • Graph width and height
  • Text size
  • Graph placement

indicator image The indicator includes multiple color presets and a fully customizable color mode, allowing traders to match their chart theme or emphasize specific activity levels.

SETTINGS

Core Inputs

  • Data: Choose between Volume or Volatility.
  • Period: Select Month, Day of Month, Day of Week, or Hours.
  • Display delta between medians: Shows relative differences as percentages, where the lowest median is 0 and the highest is 100. This dramatically improves visual clarity.

Graph Settings

  • Graph: Select graph placement.
  • Size: Choose overall graph size.
  • Width: Adjust horizontal scale.
  • Height: Adjust vertical scale.

Style Settings

  • Colors: Select a color map (Viridis, Plasma, Magma, or Custom).
  • Custom Cold: Define the color for low values.
  • Custom Lukewarm: Define the color for medium values.
  • Custom Hot: Define the color for high values.

FAQ

What type of trading indicator is Peak Trading Activity Graphs?
It is a time-based trading indicator focused on analyzing historical volume and volatility patterns to improve execution timing and risk management.

How can this indicator improve a trading strategy?
By identifying when markets are most and least active, traders can align strategy selection, position sizing, and execution timing with historically favorable conditions.

Does this indicator work for all markets?
Yes. It can be used on futures, forex, crypto, equities, and indices, making it a versatile trading indicator across asset classes.

How do I access Peak Trading Activity Graphs?
You can get access on the LuxAlgo Library for charting platforms like TradingView, MetaTrader (MT4/MT5), and NinjaTrader for free.

Free indicator

Get free access to this indicator on the platforms below.

TradingView
NinjaTrader
MetaTrader 4/5

Unlock the entire LuxAlgo Library

Every indicator, every strategy, full charts, and complete access to Quant — our AI agent.