Periodic Activity Tracker
 By LuxAlgoMar 28, 2024
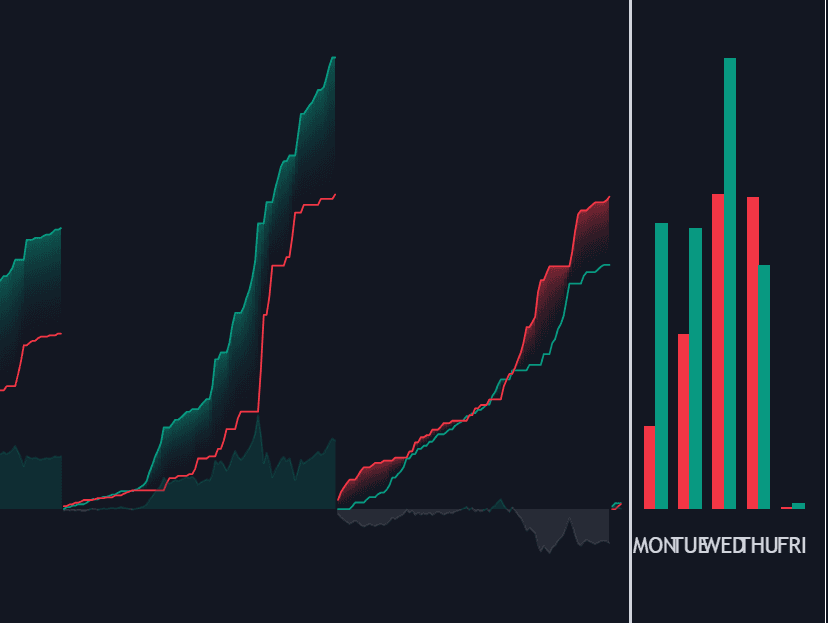
Periodic Activity Tracker accumulates buy and sell volume separately inside each period you anchor it to (hourly, daily, weekly, or monthly) and draws the result as gradient-colored lines, per-period volume bars, and a running delta. Four consecutive periods sit side by side with delimiters and tags, turning intraday activity patterns and calendar rhythm into a direct read of which side is pressing.
How to Trade the Periodic Activity Tracker?
- Green line climbing fastest: aggressive buyers dominate the period's tape.
- Red line climbing fastest: sellers are the ones attacking.
- Positive, expanding delta: buyer strength with follow-through, the pattern that accompanies sustained pushes higher.
- Matched volumes, flat delta: neither side in control, typical of ranging or contested periods.
Reading periods in sequence shows the balance evolving: matched months followed by a surge in buy volume and a widening delta is the tracker's classic pressure-building sequence. Weekly and daily anchors likewise expose day-of-week effects in participation.
Periodic Activity Tracker Settings
- Anchor Period: the aggregation window: Hourly, Daily, Weekly, or Monthly.
- Bar Width: sizing of the per-period volume bars, with a warning at the maximum.
- Delta Display: enables or disables the delta area.
- Volume colors for each side are selectable.
Frequently Asked Questions
Free indicator
Get free access to this indicator on the platforms below.

The Library is free. Quant makes it yours.
Pull any concept or indicator into Quant: rebuild it, retune it, or turn it into a backtested strategy of your own.