Concept
Intraday Time-of-day Effects
Intraday Time-of-day Effects, also known as lunch doldrums, power hour, are Time, Sessions & Seasonality concepts. The Library holds 8 implementations, each one a working definition you can pull into Quant.
Top Intraday Time-of-day Effects indicators
The top custom implementations, built on the original standard Intraday Time-of-day Effects formula.
8 total
Any of the 8 Intraday Time-of-day Effects implementations below can become a backtested trading strategy — describe your rules and Quant writes the code.
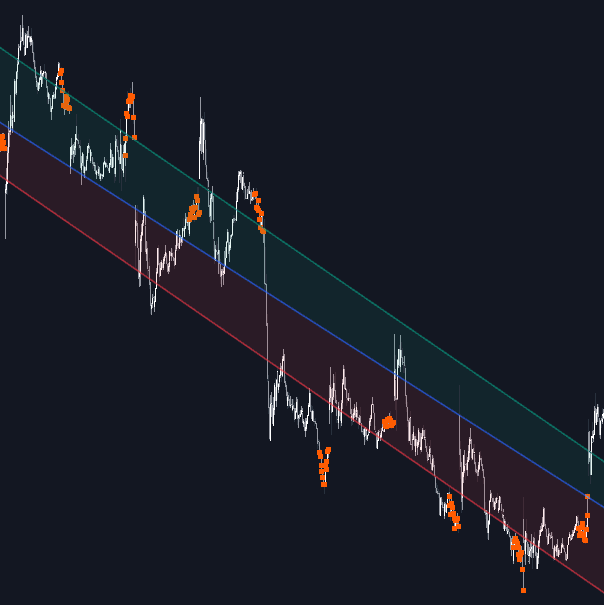
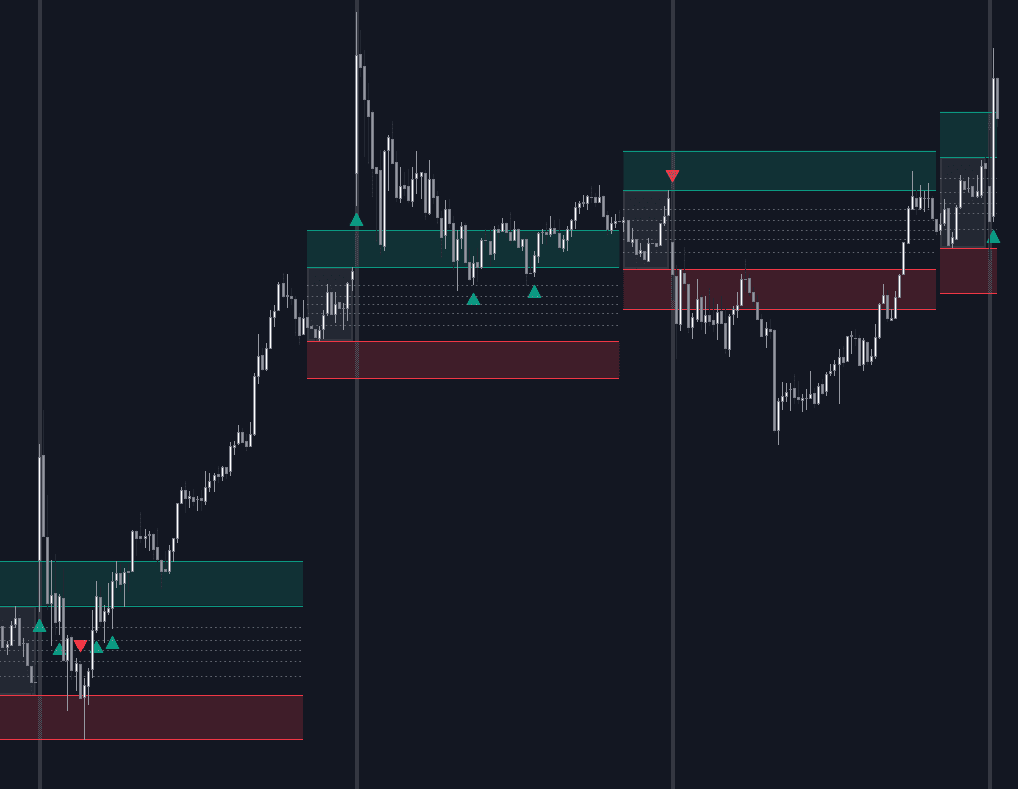
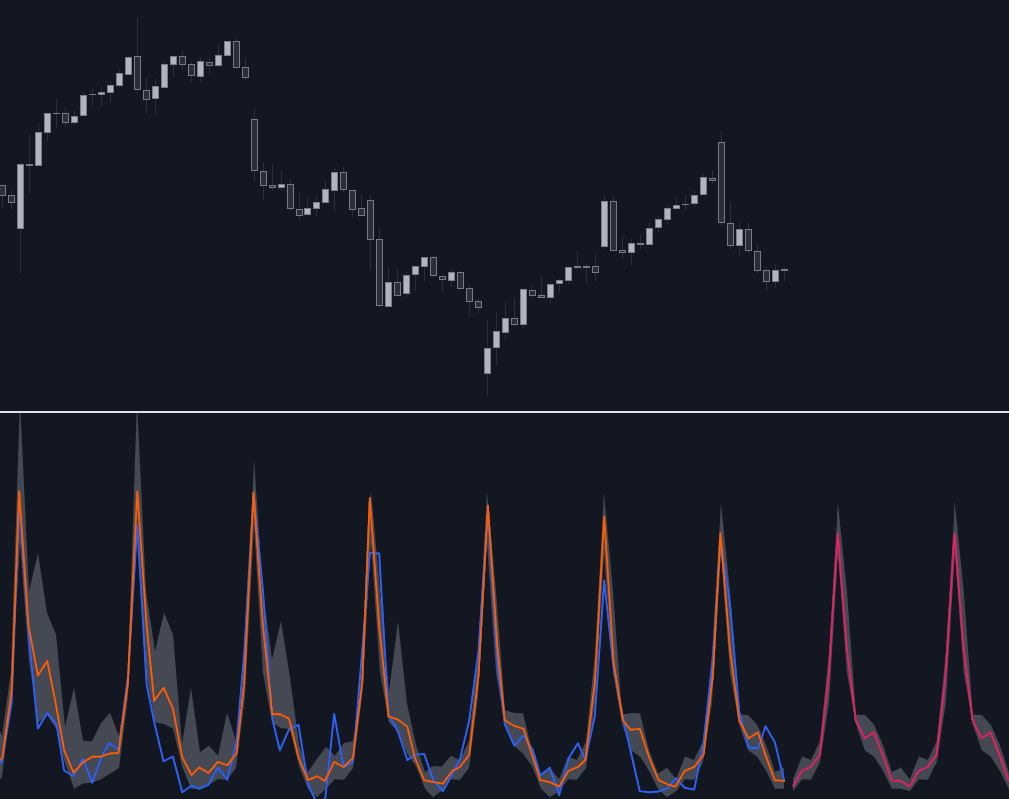
What are Intraday Time-of-day Effects?
Intraday time-of-day effects are the repeatable patterns that volume, volatility, and liquidity trace across the trading day. On equity markets, activity typically runs heavy in the first hour after the open, thins into a midday lull traders call the lunch doldrums, and re-accelerates into the close, the stretch nicknamed power hour. Averaged over many days, volume and range per time slot form the U-shaped curve documented in market microstructure research. The causes are mechanical: overnight news reprices at the open, institutions work orders benchmarked to VWAP and the closing price, market-on-close imbalances land late, and economic releases arrive at fixed clock times.
The clock matters beyond markets with a bell. FX activity concentrates where trading sessions overlap, the London-New York overlap above all, and even 24/7 crypto keeps a schedule tied to US and European hours. The practical point is that a signal's meaning depends on when it fires: a breakout on thin lunchtime volume fails more readily than the same breakout in an active window, and an indicator calibrated on midday volatility is mis-scaled at the open. Time-of-day context is one of the cheapest filters available, but it describes averages; any single day, especially a news day, can ignore the script.
How to measure time-of-day effects
A time-of-day profile is an average across many days, so the work is mostly careful bookkeeping.
- 1Bin the day. Split the session into fixed clock-time slots (5, 15, or 30 minutes are common) in a single stated timezone, and decide explicitly how daylight-saving transitions are handled.
- 2Average across days. For each slot, compute the mean or median volume and bar range over a large sample of days; medians resist distortion from one-off event days.
- 3Read the curve. Peaks mark the active windows (the open, major session overlaps, the close) and troughs mark the doldrums. Comparing today's slot against its own historical average, the logic behind relative volume, flags abnormal days early.
- 4Separate scheduled events. Days with major releases behave differently by design, so profile them apart from ordinary days or the averages will blur both regimes.
How traders use it
- As a trade-window filter: breakout and momentum entries are often restricted to statistically active windows (the first hour, session overlaps, the final hour) and switched off through the midday lull, where compressed ranges make false starts more common.
- To normalize readings: judging current volume or volatility against the same clock-time's average, rather than against the last few bars, stops the open from always looking extreme and lunchtime from always looking dead.
- To adapt risk through the day: when volatility tends to expand into the close, later entries argue for wider stops or smaller size, and some intraday traders simply flatten ahead of windows their profile marks as dead.
- As raw material for session playbooks: session high/low statistics and opening range models are time-of-day effects made tradable, pinning down when extremes and directional moves tend to occur.
Intraday Time-of-day Effects vs related concepts
Session Open/close Behaviors: That concept zooms in on the events at session boundaries: opening auctions, gaps, closing rotations. Time-of-day effects cover the entire intraday clock, including the quiet stretches between the boundaries.
Killzones: Killzones are named, prescriptive windows from the ICT school, chosen because institutional activity is expected there. Time-of-day effects are the measured tendencies such windows can be derived from and tested against.
Day-of-week Effects: The same family of calendar seasonality at a coarser grain: day-of-week effects compare Mondays with Fridays, while time-of-day effects compare 10 am with 2 pm inside a single day.
More Intraday Time-of-day Effects implementations
Concept family
Time, Sessions & Seasonality
32 concepts mapped · 32 in the Library
Intraday Time-of-day Effects FAQ
Turn Intraday Time-of-day Effects into a trading strategy.
Take any implementation from this page into Quant, then build on it, backtest it on real data, and keep refining it in conversation.