Re-accumulation vs Re-distribution Diagnosis
 By LuxAlgoJun 3, 2026
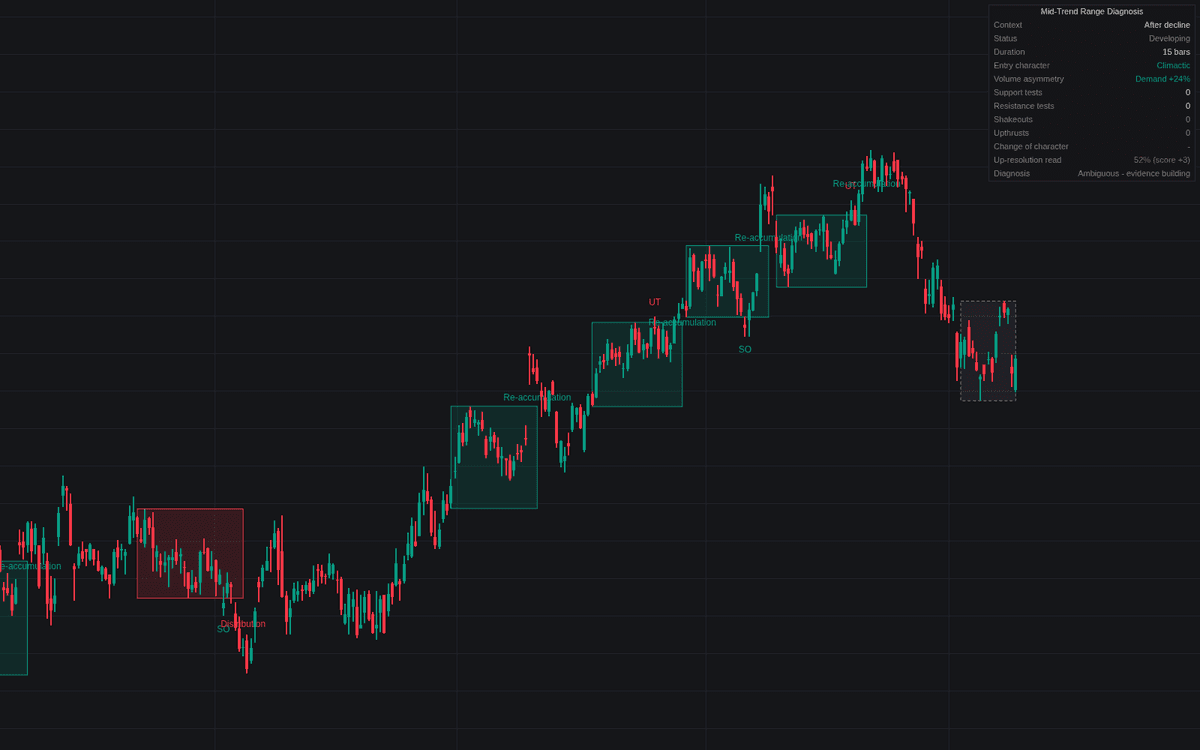

Re-accumulation vs Re-distribution Diagnosis scores the mid-trend question: pause or reversal. A compression after a qualifying trend leg opens the re-accumulation vs re-distribution diagnosis, and evidence is weighed (entry character, volume asymmetry, edge tests, shakeouts versus upthrusts, the change-of-character tell) into a signed score read as an up-resolution percentage. The box shades with the score; only a held break settles it.
How to Trade the Re-accumulation vs Re-distribution Diagnosis?
- Evidence labels: ST support tests (drying up bullish, harder bearish), SO shakeouts, UT upthrust failures, CHoCH an out-scaled counter-trend reaction.
- Lean crossings: a score beyond the lean threshold reads re-accumulation likely or distribution risk (mirrored after declines); alerted both ways.
- Resolution: closes holding beyond an edge settle re-accumulation, distribution, re-distribution or accumulation; follow-through volume noted.
Re-accumulation vs Re-distribution Diagnosis Settings
- Trend Lookback (Bars) (default 50), Minimum Trend Leg (xATR) (default 3.0), ATR Length (default 14): the qualifying leg.
- Compression Window (Bars) (default 15), Maximum Range Height (xATR) (default 3.0), Break Hold (Bars) (default 3), Maximum Range Duration (Bars) (default 400).
- Evidence: Reaction Window (Bars) (default 5), Volume Average Length (default 20), Climactic Volume Multiple (default 2.0), Edge Zone (% of Range Height) (default 20), Test Volume Step (Ratio) (default 1.15), Change of Character Multiple (default 1.1), Follow-through Volume Multiple (default 1.2).
- Continuation Prior (Score Points) (default 15) and Diagnosis Lean Threshold (default 20): with-trend tilt; lean bar.
- Show Dashboard (on), Position (Top Right), Size (Small); Show Range Box, Evidence Event Labels, Resolution Labels (on), Range Fill Transparency (default 85).
Frequently Asked Questions

Original indicatorBuilt in-house by LuxAlgo
The Library is free. Quant makes it yours.
Pull any concept or indicator into Quant: rebuild it, retune it, or turn it into a backtested strategy of your own.