Concept
Positive Volume Index
Positive Volume Index is a Volume & Order Flow concept. The Library holds 1 implementation, a working definition you can pull into Quant.
PVI
Top Positive Volume Index indicator
The top custom implementation, built on the original standard Positive Volume Index formula.
1 total
From studying Positive Volume Index to trading it: take the implementation below into Quant and backtest it instantly.
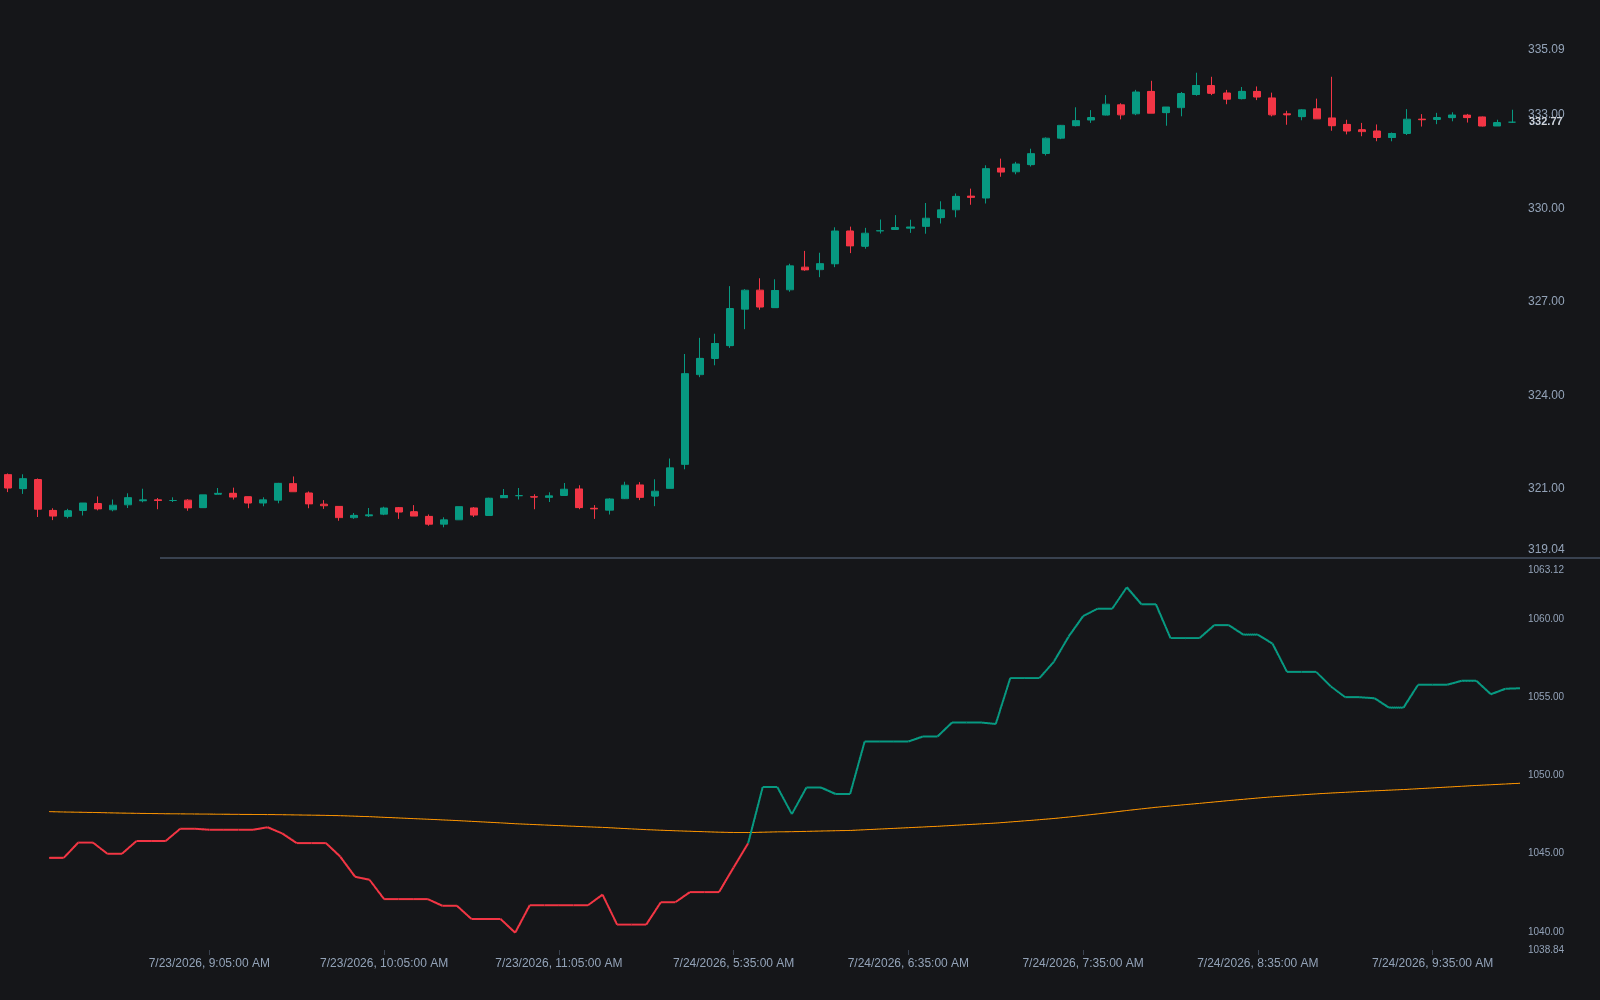
What is the Positive Volume Index?
The Positive Volume Index (PVI) is the mirror of the Negative Volume Index: a cumulative line that updates only on sessions when volume rises above the prior session's volume, moving by that day's percentage price change and staying flat otherwise. It shares the same lineage, Paul Dysart in the 1930s and Norman Fosback's 1976 refinement, with the premise turned around: expanding volume marks days dominated by the crowd, so PVI tracks what price does when participation is broad and emotional.
PVI is judged like its sibling: slope and position against a long average of itself, commonly a one-year (255-day) EMA, with the line above its average read as a bullish environment. Fosback himself put more weight on NVI, and PVI is mostly used to complete the pair, showing whether crowd-driven days confirm or contradict what the quiet days say.
Fosback's own tables explain the hierarchy. In his mid-century samples the NVI-above-average condition carried the striking bull-market odds, while PVI's readings were meaningful but weaker in both directions, the crowd's days being noisier evidence than the quiet ones. That ranking made PVI the confirmation instrument: its job is corroboration and contradiction rather than headline signals. The construction details mirror the sibling exactly, an arbitrary seed such as 1000, percentage-change updates on active days only, and the roughly-one-trading-year EMA as the conventional regime line.
The joint reading is where the pair earns its keep. Four states exist, each line above or below its average, and the classic interpretation runs: both above, the strongest bullish configuration; both below, the weakest; NVI above with PVI below, quiet accumulation the crowd has not joined; the reverse, crowd enthusiasm the quiet days do not endorse. Modern derivatives fold the pair into oscillator form, the dual volume divergence approach deriving positive and negative flows and reading their disagreements with price. The standing caveats mirror NVI's: index-level data suits the premise best, and the loud-day/quiet-day split blurs in an era when volume expansion is as often mechanical as emotional.
How to identify Positive Volume Index readings
Same recipe as the sibling, opposite filter: only the rising-volume days speak.
- 1Each session, compare volume with the prior session; only sessions with higher volume update the line.
- 2On those active days, multiply the running value by one plus the day's percentage price change; otherwise carry it flat.
- 3Overlay the conventional signal: a 255-day EMA of the line itself.
- 4Read regime, not wiggles: slope and position versus the long average are the outputs.
- 5Join the sibling: place the reading in the four-state NVI-and-PVI matrix, where the pair's agreement or split is the actual signal.
How it's calculated
A cumulative index that moves only on higher-volume days, tracking how price behaves when the crowd is most active.
Paul Dysart's 1930s original accumulated raw changes on higher-volume days; Norman Fosback's percent-change form shown here is the modern standard.
Fosback treated PVI below its one-year EMA as a warning of elevated bear-market odds, with readings above it the normal state.
Mirror of the Negative Volume Index, which updates only when volume falls.
How traders use it
- As a participation gauge: PVI rising during an advance shows the high-volume days are pushing price up, while PVI falling as price grinds higher suggests the active days are being sold into.
- Against its one-year EMA as a regime filter, read jointly with NVI: both above their averages is the most bullish classic configuration, both below the most bearish, and splits are treated as mixed evidence.
- In divergence work: PVI printing lower highs against higher price highs flags that heavy-participation days are underperforming, a cousin of Volume Divergence on daily data.
- As the crowd-side input in derived oscillators: dual-flow constructions compute PVI-style and NVI-style series, smooth them, and trade their divergences, converting the regime pair into swing-scale signals.
- For advance quality audits: comparing which side of the pair is doing the work in a rally, quiet-day accumulation versus loud-day chasing, grades the advance's sponsorship in Fosback's original terms.
PVI vs related volume lines
Negative Volume Index: The exact mirror and the historically stronger half: NVI listens to quiet days, PVI to loud ones, and Fosback's tables gave the quiet days the better record. The pair's four-state joint read is the full instrument; either alone is half a conversation.
OBV: OBV accumulates every day's volume signed by close direction, one undifferentiated stream; the Dysart-Fosback pair splits the tape by volume expansion first and accumulates percentage change second. OBV asks who is winning overall, PVI asks how the crowd's days specifically are going.
Volume Divergence: Volume divergence is the general read, price extremes unmatched by participation measures; PVI feeds it a specific, filtered series. A PVI divergence says the heavy-participation days are failing to confirm, a narrower and sometimes earlier statement than raw volume disagreement.
Concept family
Volume & Order Flow
88 concepts mapped · 88 in the Library
Positive Volume Index FAQ
Turn Positive Volume Index into a trading strategy.
Take the implementation from this page into Quant, then build on it, backtest it on real data, and keep refining it in conversation.