PPO
 By LuxAlgoMar 31, 2026
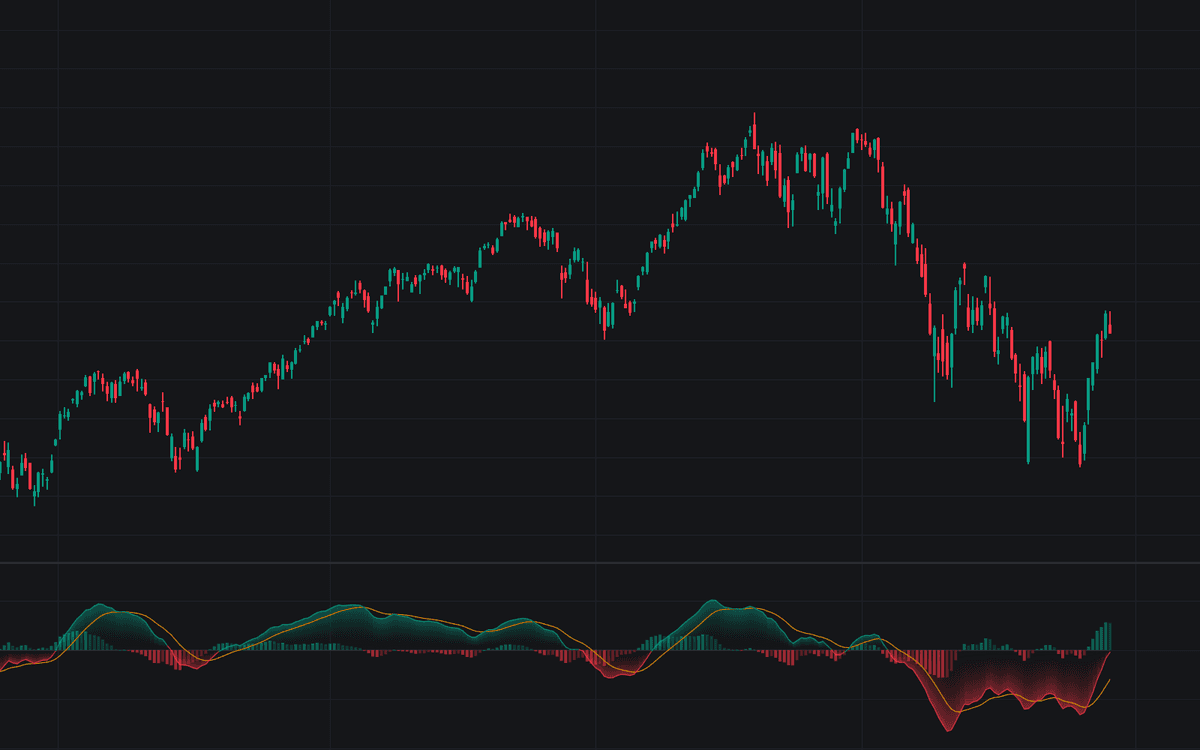

PPO states momentum as the percentage gap between a fast and a slow moving average (fast minus slow, divided by slow, times 100), so +2 always reads the same way (fast average riding 2% over the slow) whatever the symbol's price level. The definitive clean build of the PPO keeps the familiar display of signal line, histogram, and zero line, and adds a histogram shading that separates a spread still widening from one already converging back toward the signal.
How to Trade the PPO?
- Signal-line crossovers: the PPO crossing its signal line is the early, noisier trigger in either direction.
- Zero-line crosses: the slower confirmation that the underlying averages themselves have crossed. Above zero the fast average leads, below it lags.
- Histogram turns: the histogram ticking back toward zero shows the spread starting to converge, which by construction happens before any signal-line cross; bright columns mark a widening spread, faded columns a narrowing one.
Because readings are percentages, the same comparisons work across an entire watchlist and across long histories where raw-unit oscillators drift with the price level. All six events fire alerts.
PPO Settings
- Source (default close): series fed into both averages.
- Fast Length (default 12) and Slow Length (default 26): the two averages whose percentage spread is the oscillator.
- Average Type (default EMA): exponential averages are the standard recipe; SMA supports simple-average relatives of the same family.
- Signal Smoothing (default 9, EMA): length and type of the signal line that smooths the PPO.
- Show Histogram (default enabled) and Gradient Fill (default enabled): the columns and the zero-line gradient; remaining Style inputs set colors.
Frequently Asked Questions

The Library is free. Quant makes it yours.
Pull any concept or indicator into Quant: rebuild it, retune it, or turn it into a backtested strategy of your own.