PVO
 By LuxAlgoMay 12, 2026
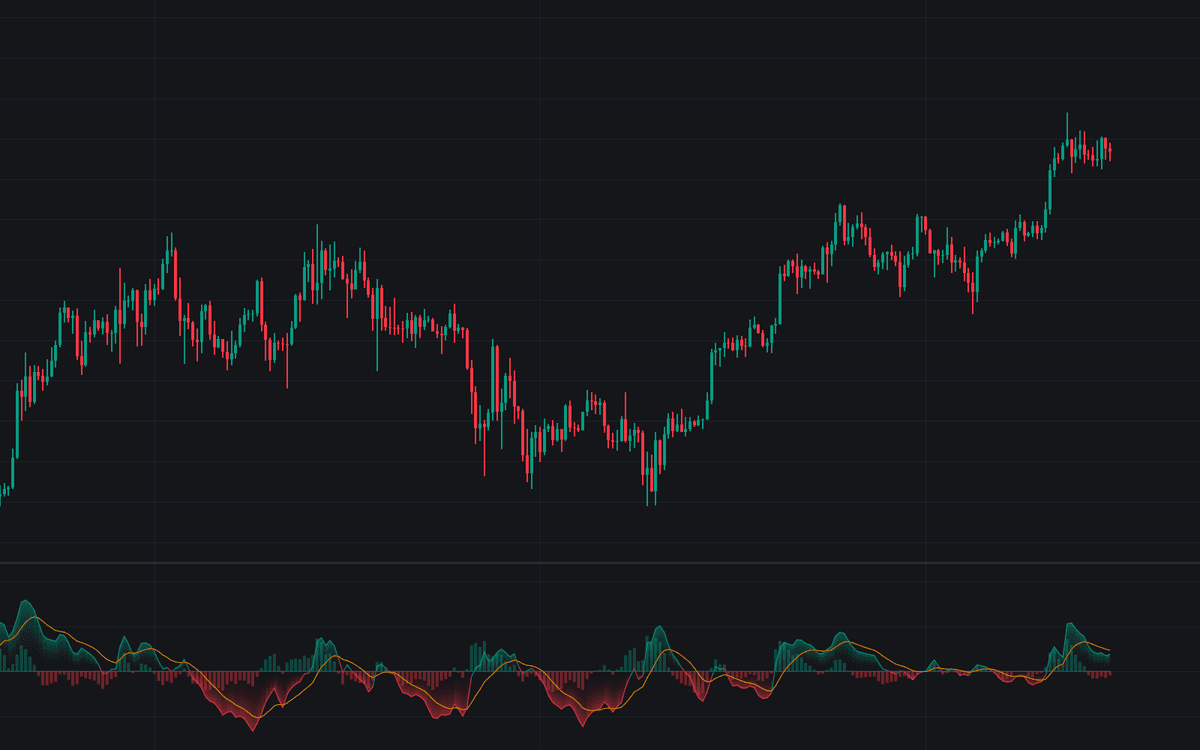

PVO applies momentum arithmetic to participation itself, the first house build of the percentage volume oscillator in the library. Two exponential averages, one quick and one slow, run over volume rather than price, and their spread is divided by the slow line to give a percentage, which frees the reading from absolute volume levels: the same number carries the same meaning on a thin small-cap and a major index future. A signal line smooths the oscillator, a histogram columns out their difference, and a gradient fill keeps the regimes readable at a glance.
How to Trade the PVO?
- Above zero: the fast volume EMA is running above the slow one. Participation is expanding against its recent baseline; below zero it is drying up. Both zero crosses are alerted, with optional circle markers.
- Signal crosses: the PVO crossing its signal line marks volume momentum turning before the zero line confirms a regime change, the earlier, noisier read.
- Read it against price: the PVO is direction-blind, since volume expands on panicked selling exactly as on eager buying. Its job is confirming or doubting the move of the day: breakouts on expansion earn trust, rallies on contraction earn suspicion.
PVO Settings
- Fast Length (default 12): the responsive volume EMA; shorter is faster but noisier.
- Slow Length (default 26): the baseline EMA. The spread is measured relative to this average, so it also defines what expansion is judged against.
- Signal Length (default 9): EMA applied to the PVO to produce the signal line.
- Show Signal Line (on), Show Histogram (on) and Zero Cross Markers (off): display only. The corresponding alerts stay available when hidden.
Frequently Asked Questions

Original indicatorBuilt in-house by LuxAlgo
The Library is free. Quant makes it yours.
Pull any concept or indicator into Quant: rebuild it, retune it, or turn it into a backtested strategy of your own.