Rate of Change
 By LuxAlgoApr 13, 2020
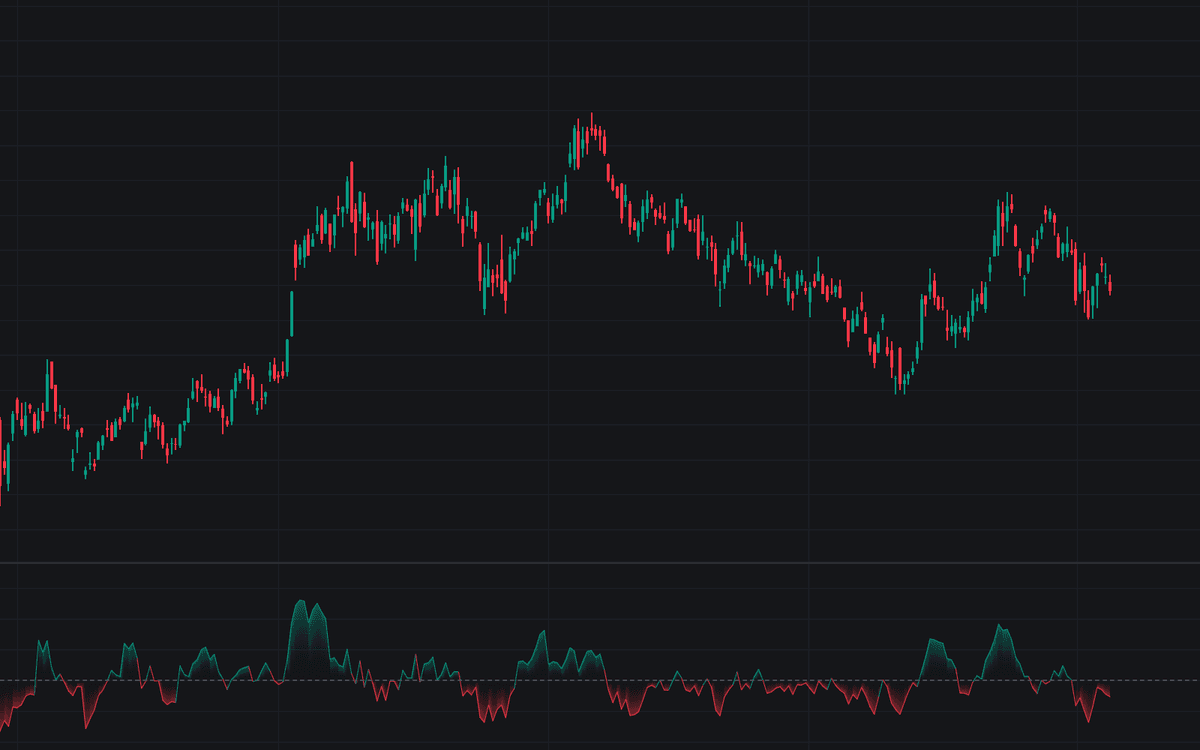

Rate of Change measures the percentage change between the current price and the price a fixed number of bars ago, plotting the result as an oscillator around a zero line so traders can read momentum in comparable percent terms. With the default length of 9, each reading answers one question: how far, in percent, has price traveled over the last nine bars? A mode input switches from ROC % (the default) to Momentum, which plots the raw price difference instead of the percentage. This is the standard raw implementation of the indicator.
How to Trade the Rate of Change?
- ROC above zero: price is above where it stood a lookback ago. Momentum is positive.
- ROC below zero: price has lost ground over the window.
- Zero cross up: the lookback comparison turns positive, a regime shift covered by an included alert.
- Zero cross down: the opposite shift, likewise covered by an alert.
- Extremes: the scale has no fixed bounds, so what counts as stretched comes from the instrument's typical range.
- Divergence: a new price extreme on a smaller ROC swing shows the rate of advance decaying.
A reading of 5 means five percent on any symbol at any price, portability no raw point difference offers.
Rate of Change Settings
- Length (default 9): the lookback period; the source is compared with its value this many bars ago. Shorter lengths make a twitchy line that catches bursts, while longer lengths describe broader momentum and cross zero less often.
- Source (default close): the series used as input for the calculation.
- Mode (default ROC %): ROC % plots the change as a percentage of the source value from the lookback; Momentum plots the raw difference in price units.
Frequently Asked Questions

The Library is free. Quant makes it yours.
Pull any concept or indicator into Quant: rebuild it, retune it, or turn it into a backtested strategy of your own.