Concept
ROC
ROC, also known as smoothed ROC, is a Momentum & Oscillators concept. The Library holds 1 implementation, a working definition you can pull into Quant.
The standard ROC indicator
ROC exactly as classically defined: the faithful reference build of the original formula, free to run in Quant.
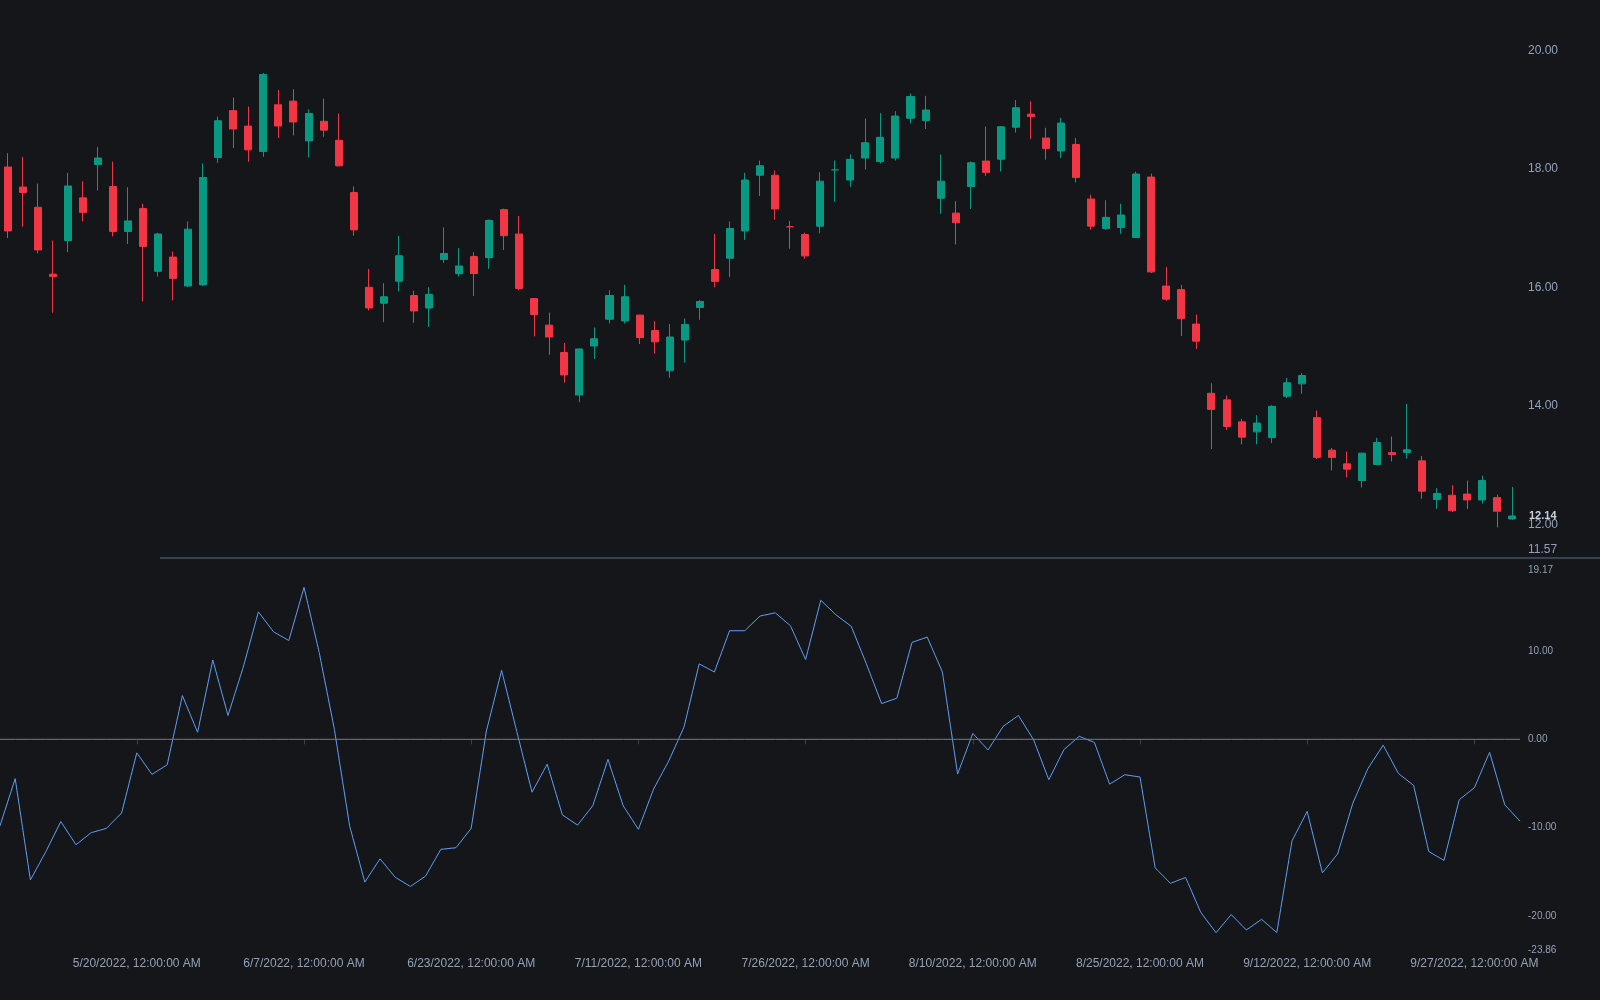
What is ROC?
ROC, rate of change, is percentage momentum: the current close minus the close n bars ago, divided by that older close, times 100. A reading of +5 means price is five percent above where it stood n bars back; zero means unchanged. It is the normalized sibling of raw Momentum, which takes the same difference in points. The percentage form is what makes ROC comparable across instruments and across time, since a 10-point move means something very different at a price of 100 than at 10,000.
ROC oscillates around zero with no upper bound, while the downside is floored at -100 for a price series that stays positive (a fall to zero), so overbought and oversold have to be judged against the instrument's own history rather than fixed levels. One structural quirk deserves respect: each reading depends on exactly two bars, the current one and the one leaving the window, so ROC can jump or slump when an extreme old bar drops out even while price stands still (the drop-off effect). Smoothed-ROC variants average the line to tame this. ROC is also the building block of larger constructions: the Know Sure Thing sums smoothed ROCs at four horizons with fixed weights, and the Coppock Curve applies a weighted average to the sum of two long-horizon ROCs.
Quantitative work often swaps the arithmetic for logarithms: the log return, the natural log of current price over the old price, is symmetric (a move up and back down nets to zero) and additive across periods, properties percentage ROC lacks once moves get large. For chart reading the two are nearly identical at small changes and diverge on big ones. The drop-off effect deserves a worked picture too: with a 10-bar ROC, a crash bar entering its eleventh bar of age exits the comparison, and the reading can leap upward on a flat day purely because the denominator's history changed, a mechanical artifact that has fooled many a scanner.
The practical ecosystem spans speed grades. Raw short ROC drives burst screens, the momentum-burst style flagging days when a stock jumps several percent as candidate ignition; double-smoothed constructions like the Price Momentum Oscillator, from the DecisionPoint tradition, turn ROC into a patient signal-line tool; divergence detectors run the standard swing comparisons on the percentage line; and cross-sectional work ranks a universe by common-window ROC as the plainest relative strength measure. One primitive, many temperaments, all inheriting the same two-bar dependency underneath.
How to identify ROC readings
One division and a scale: the reading discipline is where the value lives.
- 1Choose the lookback n: swing work commonly runs 9 to 14 bars, cycle work far longer, and the choice defines which momentum you measure.
- 2Compute the percentage: current close minus the close n bars ago, divided by that old close, times 100.
- 3Smooth if the raw line's jumpiness costs more than the lag: a short average, or a double-smoothed variant for signal-line work.
- 4Define extremes honestly: percentile rank against the instrument's own history, since the unbounded scale supports no universal thresholds.
- 5Read the standard grammar: zero-line position and crosses for bias, history-relative extremes for stretch, and swing divergences for fading participation.
How it's calculated
The percentage change of the closing price over the last n bars.
Some platforms plot the plain ratio without the 100 scaling.
The smoothed variant shown is Fred Schutzman's S-RoC, a ROC of an EMA; smoothing the ROC line itself with a short moving average is a common alternative.
ROC is zero where price equals its close n bars ago.
How traders use it
- As a zero-line bias read: positive and rising ROC frames upward pressure, and zero-line crosses serve as simple momentum triggers, though raw crosses are noisy enough that most systems filter them with a trend condition or smoothing.
- As history-relative extremes: because the line has no fixed bounds, stretched readings are defined by percentile rank against the instrument's own past rather than by universal thresholds.
- As a divergence source: price setting a new extreme while ROC sets a lesser one is the standard regular divergence read, applied to percentage momentum.
- As a cross-sectional ranking: ROC over a common lookback is a simple basis for relative strength comparisons and rotation work, ranking instruments by percentage change over the same window.
- As a burst screen: threshold rules on short ROC, a day up several percent on volume, flag ignition candidates in momentum-burst style scanning, where the percentage form is what lets one threshold serve a whole watchlist.
ROC vs its rate-of-change relatives
Momentum: The same difference without the division: momentum is in points, ROC in percent. Over stretches where the base price changes little they trace nearly identical shapes; across instruments or long spans of time, only ROC stays comparable.
ROC-of-ROC: The second derivative: ROC applied to ROC measures whether momentum itself is accelerating or decaying, one step further from price and one step noisier.
TRIX: Also a one-bar percentage rate of change, but taken on a triple-smoothed EMA of price rather than raw closes, which filters out most of the noise ROC is known for.
Concept family
Momentum & Oscillators
91 concepts mapped · 91 in the Library
ROC FAQ
Turn ROC into a trading strategy.
Take the implementation from this page into Quant, then build on it, backtest it on real data, and keep refining it in conversation.