Concept
Re-accumulation vs Re-distribution Diagnosis
Re-accumulation vs Re-distribution Diagnosis are Wyckoff concepts. The Library holds 1 implementation, a working definition you can pull into Quant.
Top Re-accumulation vs Re-distribution Diagnosis indicator
The top custom implementation, built on the original standard Re-accumulation vs Re-distribution Diagnosis formula.
1 total
The Re-accumulation vs Re-distribution Diagnosis implementation below can become a backtested trading strategy — describe your rules and Quant writes the code.
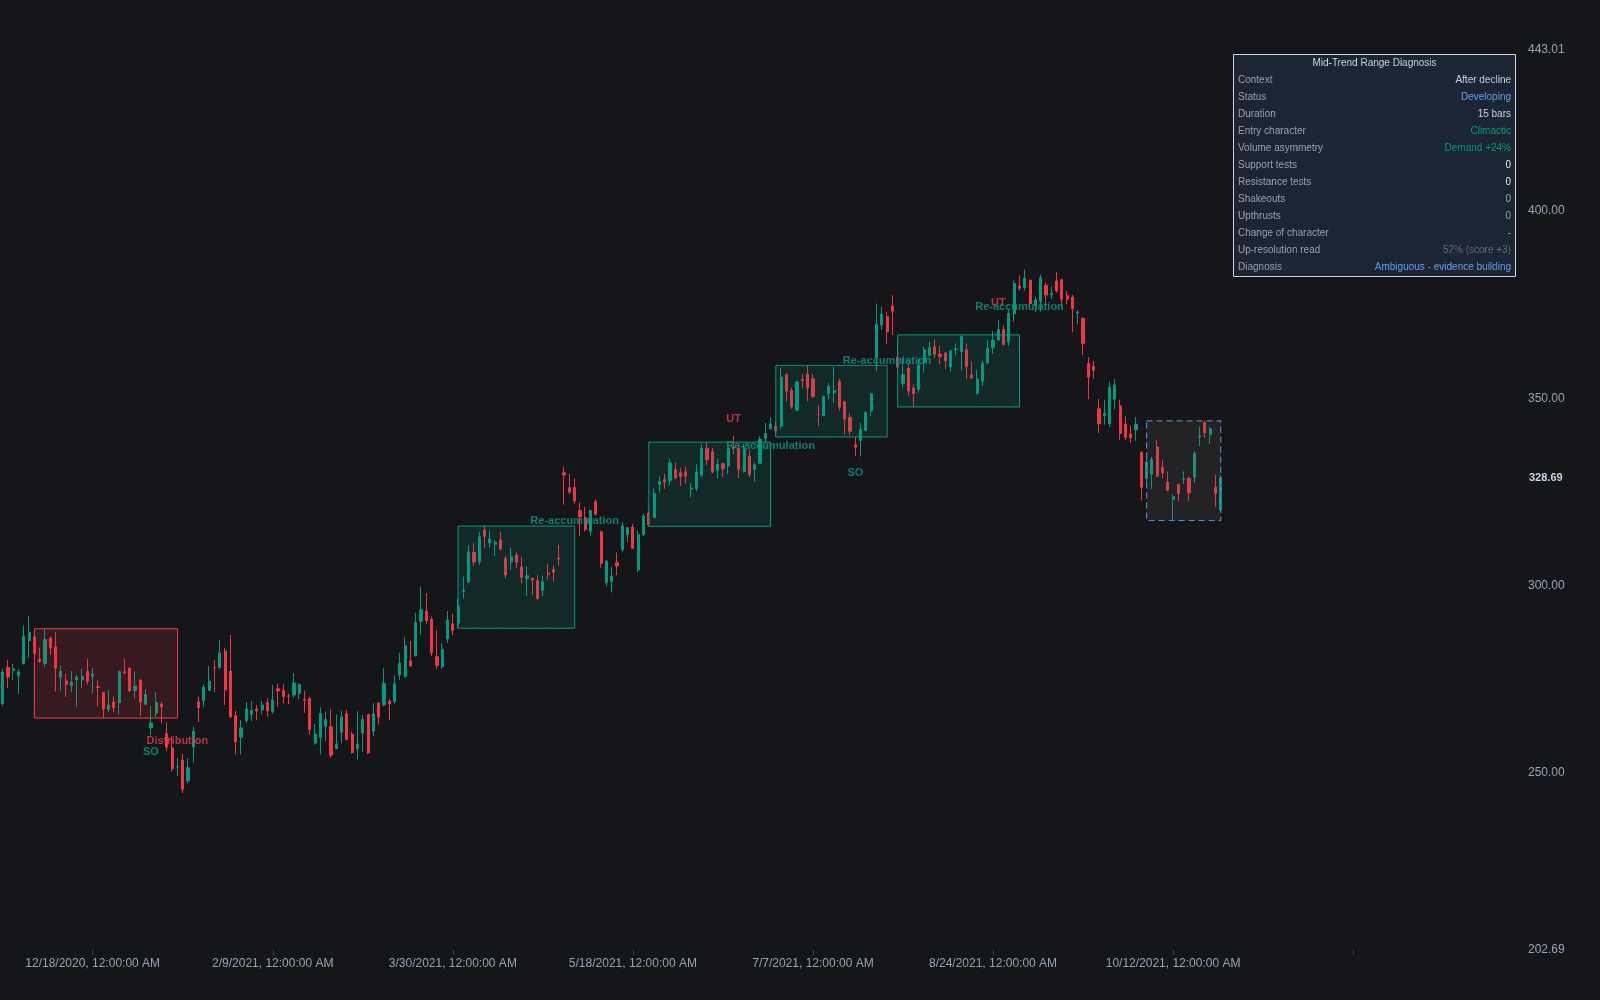
What is re-accumulation vs re-distribution diagnosis?
Re-accumulation vs re-distribution diagnosis is the Wyckoff discipline of deciding what a consolidation inside an existing trend actually is: a pause where the campaign adds to positions before continuing, or the start of the opposite campaign that will reverse the trend. A range that forms after an advance is either re-accumulation, which resolves upward, or distribution, which resolves downward; a range after a decline is either re-distribution or accumulation. The chart geometry of these outcomes can look nearly identical while they are forming, which is precisely why the diagnosis matters.
The diagnostic evidence is behavioral rather than geometric. Wyckoff readers weigh how the range was entered (climactic or orderly), how volume behaves on rallies versus reactions inside it, whether support or resistance is being defended, and how tests at the edges resolve. In re-accumulation, reactions tend to shrink in spread and volume while absorption shows at the lows; in distribution disguised as a pause, rallies attract supply, effort vs result deteriorates on the upside, and support gets tested harder each time.
Traders care because the two readings dictate opposite behavior with the same position: hold or add through re-accumulation, but exit or reverse ahead of distribution. Getting it wrong in one direction surrenders a trend; getting it wrong in the other rides a reversal down. No single bar settles the question, and honest practitioners treat the diagnosis as a running probability that updates with each test rather than a verdict issued early.
How to diagnose a mid-trend range on a chart
The diagnosis accumulates evidence across the range's entry, interior, and edge tests. For a range after an advance, the question is re-accumulation versus distribution; mirror the logic after a decline.
- 1Assess the entry: an orderly, low-urgency drift into the range leans continuation, while climactic upside volume followed by an automatic reaction and heavy two-sided trade raises the odds a top is being built.
- 2Track volume asymmetry inside the range: shrinking reactions with volume drying up on dips favors re-accumulation; expanding volume on down-swings and fading volume on rallies favors distribution.
- 3Watch which edge is defended: repeated successful tests of support on diminishing volume lean bullish, while repeated failures just above resistance, upthrust-style, lean bearish.
- 4Look for a change of character: the first reaction inside the range that is materially wider and heavier than anything seen during the prior trend is often the earliest distribution tell.
- 5Let the resolution confirm: a shakeout under support that recovers quickly reads as the final re-accumulation test, while a clean break that holds below on follow-through volume settles the case the other way.
How traders use it
- For trade management in trends: position holders use the diagnosis to decide whether a consolidation is a place to add, sit tight, or take profits, instead of reflexively exiting every pause.
- To frame continuation entries: a range diagnosed as re-accumulation offers entries near its support with risk defined under the shakeout low, often a better price than chasing the breakout.
- As an early-warning system: the distribution tells, heavy rallies that fail and hard tests of support, frequently appear well before the trendline breaks, giving time to lighten up.
- With humility about base rates: in strong trends most pauses are continuation, so many practitioners require strong contrary evidence before calling a reversal, accepting that they will occasionally be late on real tops.
- Alongside counts: a point & figure count across the pause that projects in line with the original campaign objective supports the continuation reading.
Diagnosis vs the underlying range types
Re-accumulation: Re-accumulation is one of the possible answers: a pause in an uptrend where positions are added before markup resumes. The diagnosis is the process of establishing that this, rather than distribution, is what the range is.
Re-distribution: Re-distribution is the downtrend counterpart, a pause that refuels markdown. Diagnosing it means separating it from genuine accumulation, using mirrored evidence: weak rallies, supply on rises, failing support.
Accumulation vs distribution ranges: That comparison addresses ranges at potential turning points after a completed trend. This diagnosis addresses ranges inside a trend, where the default expectation is continuation and the burden of proof sits with reversal.
Concept family
Wyckoff
17 concepts mapped · 17 in the Library
Re-accumulation vs Re-distribution Diagnosis FAQ
Turn Re-accumulation vs Re-distribution Diagnosis into a trading strategy.
Take the implementation from this page into Quant, then build on it, backtest it on real data, and keep refining it in conversation.