Re-accumulation
 By LuxAlgoMay 23, 2026
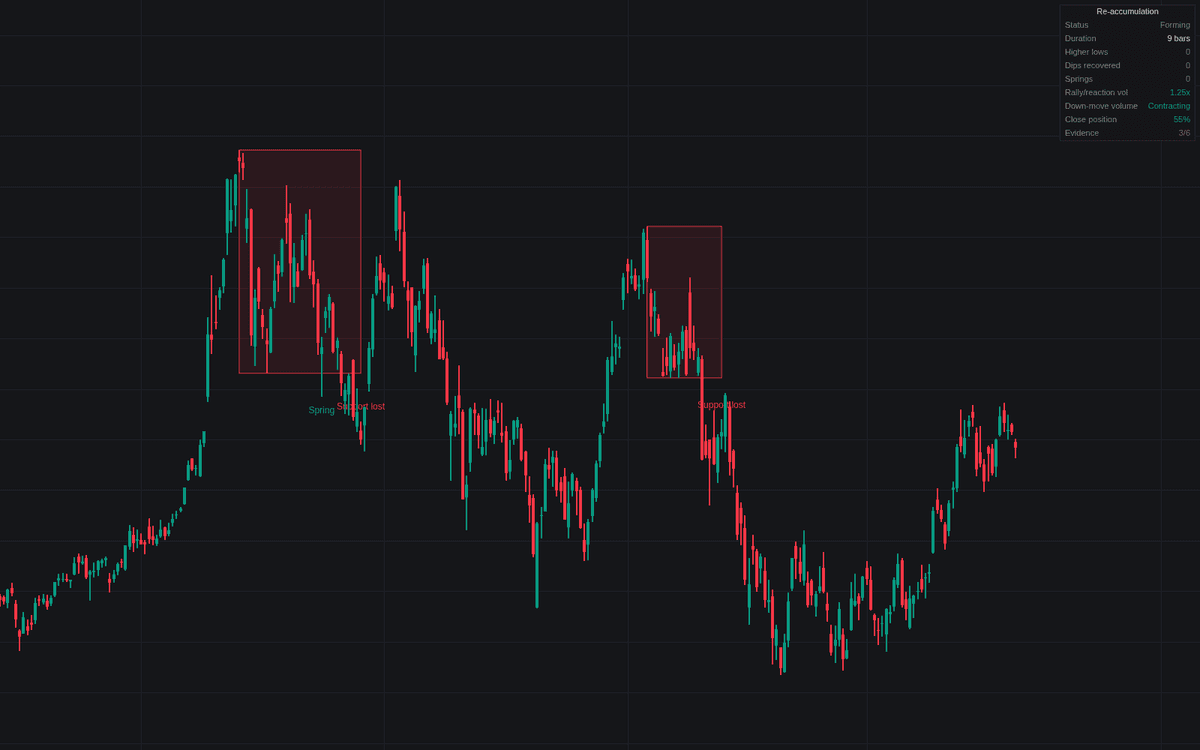

Re-accumulation tracks the pause that decides whether an uptrend earns another leg. When a stall high caps a qualifying ATR-normalized advance, the build opens a candidate range and starts the checklist behind re-accumulation: higher lows, quick support-zone recoveries, springs, rallies out-carrying reactions on volume, contracting down-move volume. Confirmation waits for a breakout holding with expanding participation; until then the bearish alternative stays live.
How to Trade the Re-accumulation?
- Range detected: the pause has lasted long enough to count as a range; the checklist goes live as context, not entry.
- Spring: a break below support recovering inside the spring window prints a Spring label, final-test behavior.
- Re-accumulation confirmed: the breakout holds the required closes above the range high with a bar at the volume multiple; box and label turn bullish.
- Support lost: closes held below support beyond the spring window invalidate. The pause turns out to have been distribution.
It sits with the other Wyckoff phase tools.
Re-accumulation Settings
- Uptrend Lookback (Bars) (default 50), Minimum Advance (xATR) (default 2.0), ATR Length (default 14): the qualifying advance.
- Swing Length (default 5): pivot strength of the boundary swings.
- Minimum Range Duration (Bars) (default 15): shorter pauses are discarded as pullbacks.
- Spring Recovery Window (Bars) (default 5): how long price may close below support and still spring back.
- Breakout Hold (Bars) (default 3), Volume Average Length (default 20), Breakout Volume Multiple (default 1.5): confirmation demands.
- Support Zone (% of Range Height) (default 25) and Dip Recovery Window (Bars) (default 5): what counts as an absorbed dip.
- Show Dashboard (on), Position (Top Right), Size (Small); Show Range Box, Higher-Low Markers, Event Labels (on), Range Fill Transparency (default 90).
Frequently Asked Questions

Original indicatorBuilt in-house by LuxAlgo
The Library is free. Quant makes it yours.
Pull any concept or indicator into Quant: rebuild it, retune it, or turn it into a backtested strategy of your own.