Concept
Re-accumulation
Re-accumulation is a Market Structure concept. The Library holds 1 implementation, a working definition you can pull into Quant.
Top Re-accumulation indicator
The top custom implementation, built on the original standard Re-accumulation formula.
1 total
From studying Re-accumulation to trading it: take the implementation below into Quant and backtest it instantly.
What is re-accumulation?
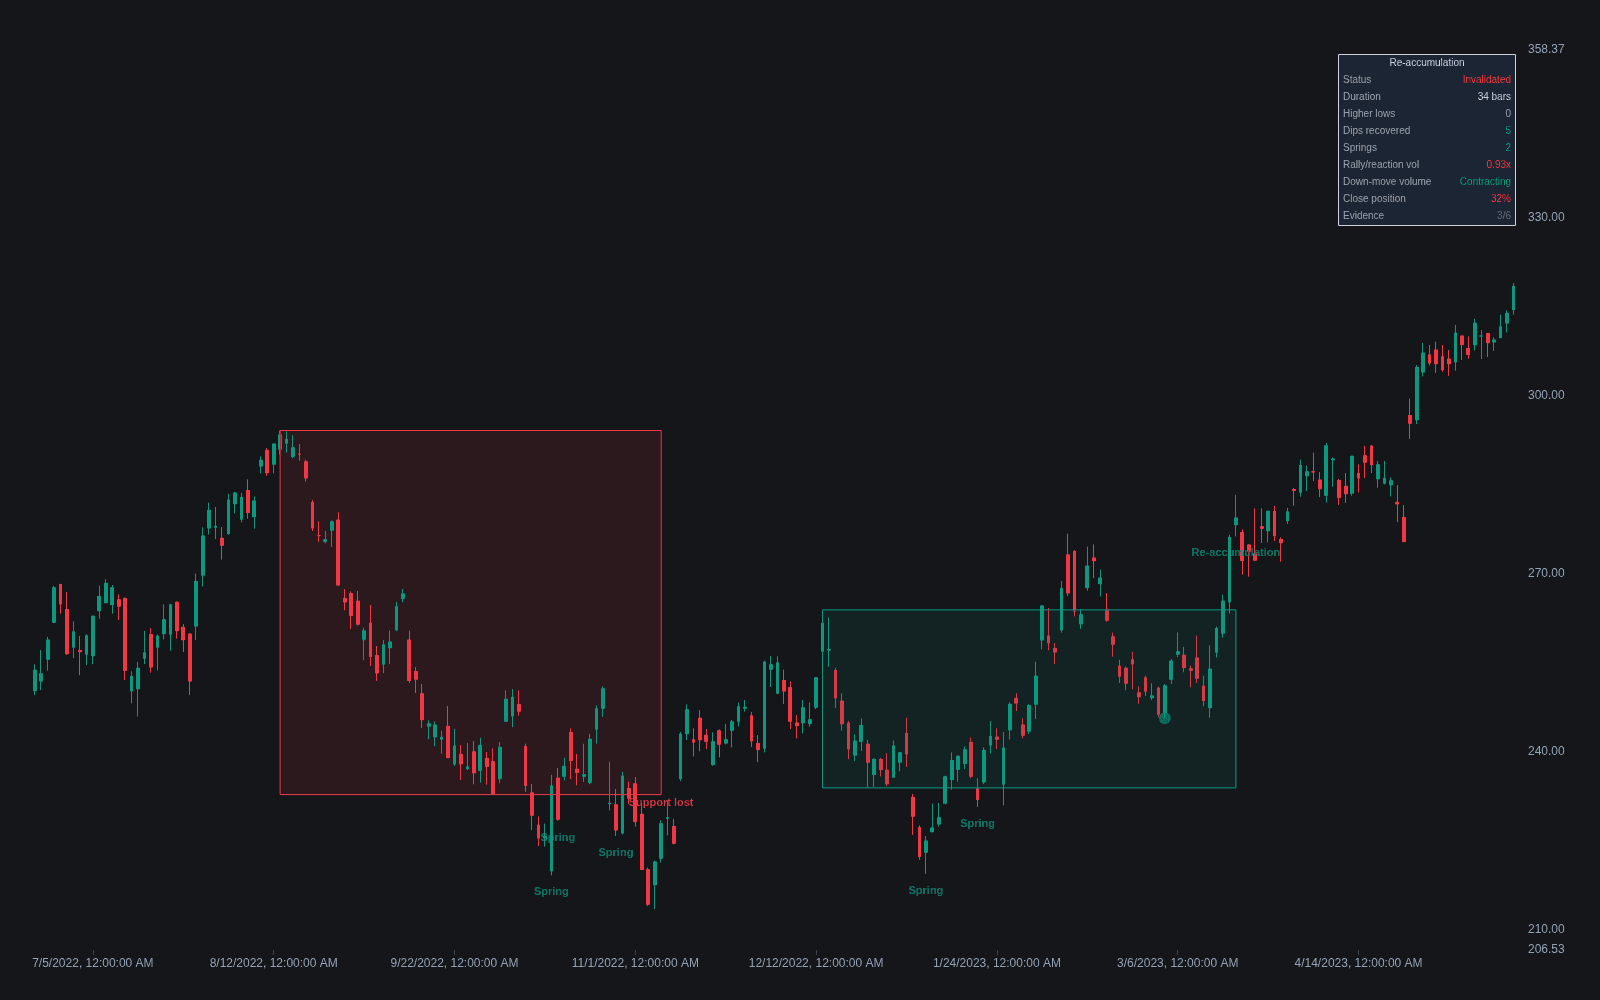
Re-accumulation is a pause in an established uptrend during which large participants absorb supply and rebuild positions before the trend resumes higher. The term comes from the Wyckoff tradition: where accumulation happens after a decline, re-accumulation happens mid-trend, inside a trading range that interrupts an ongoing markup. Externally it looks like ordinary sideways consolidation; the label asserts something about what is happening inside the range, namely that stronger hands are buying the dips faster than weaker hands are selling the rallies.
The concept exists because trends rarely move in one continuous leg. Profit-taking, stop placement, and fresh short selling create supply along the way, and that supply has to be absorbed before price can advance efficiently. In Wyckoff Method terms, the range is where new cause is built for the next effect, and cause and effect reasoning treats the size of the range as loosely proportional to the size of the following leg.
Traders care about the label because the same sideways chart can precede opposite outcomes. If the range is re-accumulation, the trend resumes upward; if it is actually distribution, the trend ends. Nothing in the price pause alone settles this, which is why diagnosis leans on behavioral evidence such as shakeouts that recover quickly, shrinking volume on down-moves, and demand appearing at progressively higher levels within the range. Even then the call is probabilistic, and honest practitioners hold the label loosely until the range resolves.
How to identify re-accumulation on a chart
The context requirement comes first: without a prior uptrend there is nothing to re-accumulate.
- 1Confirm an established uptrend into the range; a sideways range after a decline is candidate accumulation, not re-accumulation.
- 2Mark the range boundaries from the first reaction high and low, then watch how price behaves at each edge rather than in the middle.
- 3Look for absorption behavior: dips into support that recover quickly, down-moves on contracting volume, and higher lows forming inside the range.
- 4Watch for a spring, a brief break below range support that fails and snaps back, which often precedes upside resolution.
- 5Treat the diagnosis as confirmed only when price breaks and holds above the range with expanding participation; before that, the bearish alternative remains live.
How traders use it
- As a trend-continuation framework: traders who believe a range is re-accumulation buy weakness near range support or buy the breakout, with invalidation below the range low.
- As a filter against premature exits: recognizing a pause as probable re-accumulation helps position holders sit through consolidation instead of selling the first sideways month.
- As a diagnostic exercise: comparing volume on rallies versus reactions, and checking where within the range closes concentrate, gives evidence for or against the label before resolution.
- As a risk anchor: the range low is the natural line in the sand, since a decisive loss of it argues the range was distribution after all. The label is a hypothesis, not a certainty, and it is wrong often enough that stops matter.
Re-accumulation vs adjacent range concepts
Re-distribution: Re-distribution is the mirror image: a mid-downtrend pause where supply is rebuilt before markdown resumes. The two labels are direction-dependent readings of otherwise similar-looking ranges.
Wyckoff accumulation schematic: The accumulation schematic describes a base after a full downtrend. Re-accumulation borrows the same internal events but occurs mid-uptrend, and typically resolves faster with a shallower shakeout phase.
Trading range: A trading range is the neutral structural fact. Re-accumulation is one hypothesis about what the range means; calling every mid-trend range re-accumulation is confirmation bias, not analysis.
Concept family
Market Structure
31 concepts mapped · 31 in the Library
Re-accumulation FAQ
Turn Re-accumulation into a trading strategy.
Take the implementation from this page into Quant, then build on it, backtest it on real data, and keep refining it in conversation.