All indicators

Retest & Break Setup

By LuxAlgoJun 19, 2026

Static chart image
Price Action BasedSupport and ResistanceSignalsPatterns

The Retest & Break Setup indicator is a price action trading indicator designed to detect breakout structures where price breaks a pivot level, returns to retest that level as support or resistance, and then breaks beyond the retest extreme to confirm trend continuation. By tracking pivot highs, pivot lows, repeated retests, and breakout confirmation, this indicator helps traders identify structured long and short trading setups based on classic support and resistance behavior.

How to Trade the Retest & Break Setup Trading Indicator

The Retest & Break Setup indicator identifies "Retest & Break" patterns by monitoring important pivot levels on the chart. Pivot Highs are used to detect bullish setups, while Pivot Lows are used to detect bearish setups.

A setup begins when price breaks through a pivot level. After the initial break, the indicator watches for price to return and "retest" the broken level. In bullish trading setups, the broken pivot high may begin acting as support. In bearish trading setups, the broken pivot low may begin acting as resistance.

A setup is considered "completed" once the required number of retests has occurred and price breaks out beyond the extreme created during the retest phase. For bullish setups, this means price must close above the highest high reached during the retest period. For bearish setups, price must close below the lowest low reached during the retest period.

A completed bullish setup suggests that buyers have defended the retested level and that price may continue moving higher. A completed bearish setup suggests that sellers have defended the retested level and that price may continue moving lower.

This type of trading strategy is often connected to liquidity and breakout confirmation. When price retests a level multiple times without fully reversing back through it, stop-loss orders and breakout orders can build around the retest extremes. When price finally breaks beyond those areas, the concentrated liquidity can help fuel a stronger move in the confirmed trend direction.

The indicator can be useful for traders looking to study:

  • Breakout trading setups after pivot breaks.
  • Support and resistance retests.
  • Trend continuation patterns.
  • Bullish and bearish price action structures.
  • Liquidity-based breakout confirmation.
  • Retest trading strategies across different timeframes.

Parameters and Setup Sensitivity

The behavior of the indicator is highly dependent on four primary settings:

  • Length: Determines the significance of the initial pivot. A higher value identifies major swing points and broader market structure levels, while a lower value identifies minor intraday levels and faster price action setups.
  • Required Consecutive Retests (K): Specifies how many times price must touch the broken level without breaking back through it. Increasing this value requires more confirmation before a setup is considered valid, which may reduce noise but also produce fewer signals.
  • Max Bars between Retests (P): Controls the "tightness" of the retest phase. If price takes too long to return for a retest, the setup is invalidated. Lower values focus on faster continuation patterns, while higher values allow slower retest structures to develop.
  • Max Bars for Break (N): Defines the window of opportunity for the final breakout. After the required retests are met, price must break the recent extreme, using the high for bullish setups and the low for bearish setups, within this many bars.

These parameters allow traders to adapt the Retest & Break Setup indicator to different market conditions, trading styles, and chart timeframes. A more sensitive configuration can highlight frequent short-term trading opportunities, while a stricter configuration can focus on higher-quality breakout patterns with more confirmation.

Finding Long-Term vs. Short-Term Setups

For users looking for longer-term, more significant trading setups, it is recommended to increase the Length value, such as 10-20, and raise the Max Bars parameters, including N and P. This gives price more time to form larger market structure breaks, deeper retests, and slower breakout confirmations that are common on higher timeframes.

For swing trading, traders may prefer larger pivot lengths and wider retest windows to focus on major support and resistance zones. This can help filter out smaller fluctuations and emphasize stronger trend continuation structures.

Conversely, for scalping or fast-moving markets, lower values for Length and P will highlight quick "touch-and-go" patterns. These settings may be useful when looking for fast breakout trading strategies on lower timeframes, but they may also produce more signals and require stricter risk management.

Retest & Break Setup Dashboard and Signal Details

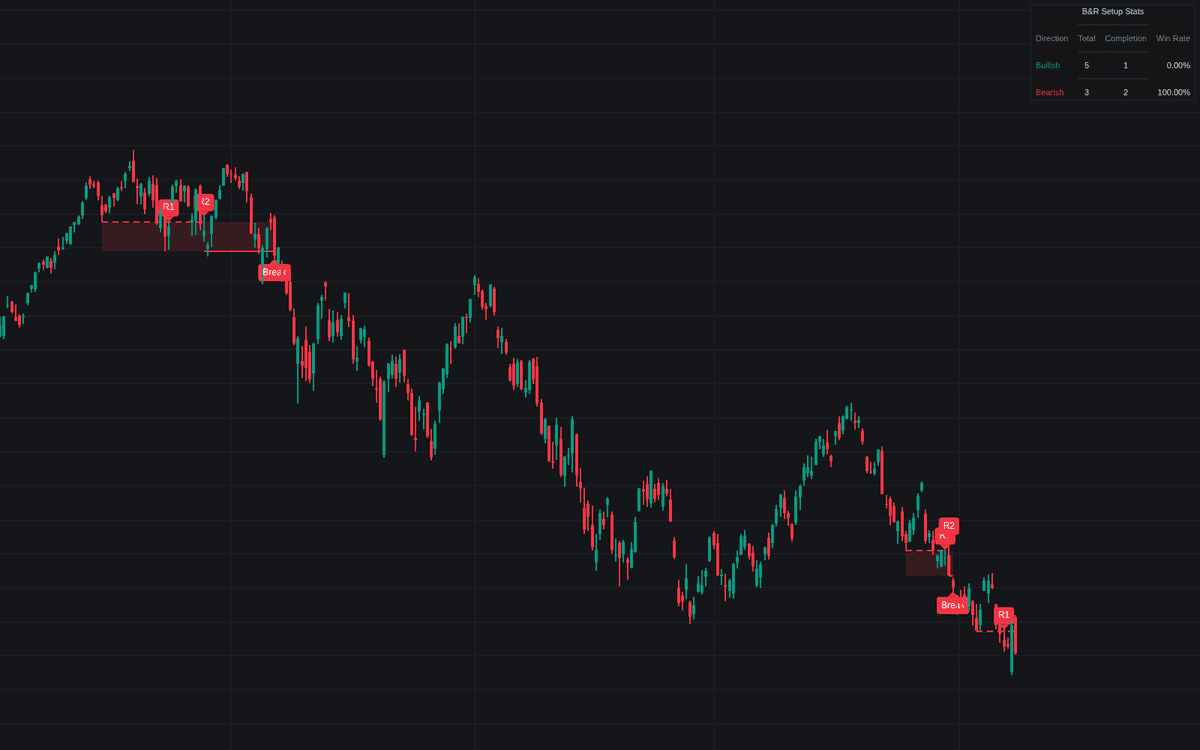
The indicator includes a comprehensive dashboard to help users evaluate the historical reliability of the identified structures on the current chart and timeframe. This makes it easier to understand how often the Retest & Break Setup trading indicator finds potential setups, how often those setups complete, and how price behaves after confirmed breakouts.

Dashboard Metrics

  • Total: This counts the number of setups that successfully completed the initial break and all required K retests. It represents the "Potential" setups that reached the final stage before waiting for breakout confirmation.
  • Completion: This tracks how many of the "Total" setups actually achieved a confirmed breakout past the retest extreme within the N bars limit. A higher completion value may suggest that the current chart and settings are better suited to this breakout trading strategy.
  • Win Rate: This is a predictive performance metric. For every "Completed" setup, the script records the price at the moment of breakout. After N bars have passed since that breakout, it checks if price is still above the breakout level for bullish setups or below the breakout level for bearish setups.

These dashboard statistics are designed to give traders additional context when analyzing the indicator. They should not be treated as guaranteed future performance, but they can help users compare different settings, symbols, and timeframes when building a retest and breakout trading strategy.

Visualization

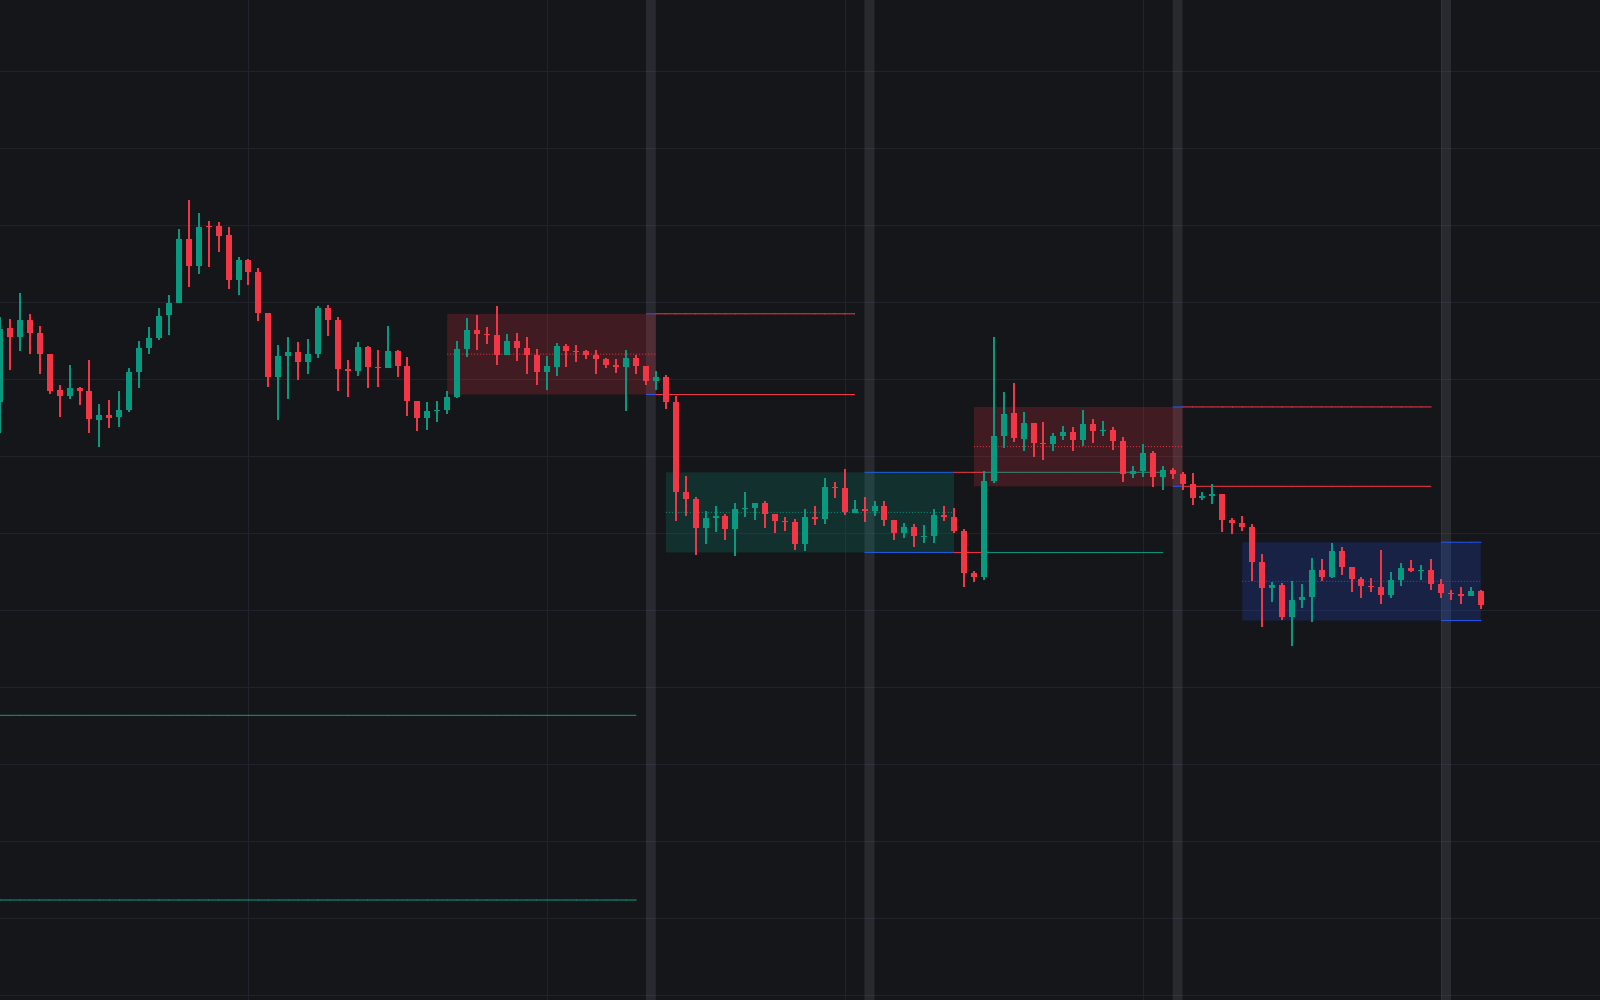
The script uses dashed lines to represent the broken pivot level being retested. These levels help traders visually identify the support or resistance area that price is testing after the initial pivot break.

Solid lines represent the "trigger" level, which is the extreme of the retest phase. For bullish setups, this trigger level is based on the highest high reached during the retest phase. For bearish setups, it is based on the lowest low reached during the retest phase.

When a setup is completed, a shaded box appears on the chart, and a "Break" label is plotted. This makes it easier to visually separate confirmed breakout setups from developing or invalidated structures.

If "Only Show Complete Setups" is disabled, invalidated setups will remain on the chart in a faded gray color for study. This can be useful for reviewing failed support and resistance retests, studying false breakouts, and improving how the indicator is configured for the current market.

The visualization system helps traders quickly identify:

  • The original broken pivot level.
  • The retested support or resistance zone.
  • The breakout trigger level.
  • Completed bullish and bearish setups.
  • Invalidated price action structures.

Retest & Break Setup Indicator Settings

  • Length: The lookback period used to detect Pivot Highs and Lows. Higher values focus on stronger swing levels, while lower values detect shorter-term pivots.
  • Max Bars for Break (N): The maximum time allowed for price to break out after the final retest. This controls how quickly a confirmed breakout must occur.
  • Max Bars between Retests (P): The maximum time allowed between the initial break and the first retest, or between subsequent retests. This helps define whether the retest structure remains valid.
  • Required Consecutive Retests (K): The number of successful retests required to validate the zone. Higher values require more confirmation before the indicator marks a potential breakout setup.
  • Only Show Complete Setups: When enabled, removes setups from the chart that failed to meet the retest or breakout criteria. This creates a cleaner chart focused only on confirmed structures.
  • Setup Colors: Customizable colors for bullish, bearish, and invalidated patterns, allowing traders to match the indicator visuals to their chart style.
  • Dashboard Settings: Options to toggle the dashboard visibility, change its position on the chart, and adjust its size.

FAQ

What is the Retest & Break Setup indicator?

The Retest & Break Setup indicator is a trading indicator that detects price action structures where price breaks a pivot level, retests the broken level, and then confirms a breakout beyond the retest extreme. It is designed for traders who use support and resistance, pivot levels, and breakout trading strategies.

How can traders use this indicator in a trading strategy?

Traders can use the indicator to identify potential bullish and bearish continuation setups. A bullish setup occurs when price breaks a pivot high, retests the level as support, and then breaks above the retest high. A bearish setup occurs when price breaks a pivot low, retests the level as resistance, and then breaks below the retest low.

What markets can the Retest & Break Setup indicator be used on?

The indicator can be applied to many liquid markets, including stocks, forex, crypto, indices, commodities, and futures. Its effectiveness depends on the selected timeframe, market conditions, and the trader's chosen settings.

What settings should I adjust first?

The most important settings to adjust first are Length, Required Consecutive Retests (K), Max Bars between Retests (P), and Max Bars for Break (N). These control how significant the pivot must be, how many retests are required, how fast the retests must occur, and how quickly the final breakout must happen.

How do I access the Retest & Break Setup indicator?

You can get access on the LuxAlgo Library for charting platforms like TradingView, MetaTrader (MT4/MT5), and NinjaTrader for free.

Free indicator

Get free access to this indicator on the platforms below.

TradingView
NinjaTrader
MetaTrader 4/5

Unlock the entire LuxAlgo Library

Every indicator, every strategy, full charts, and complete access to Quant — our AI agent.