RMA
 By LuxAlgoApr 11, 2026
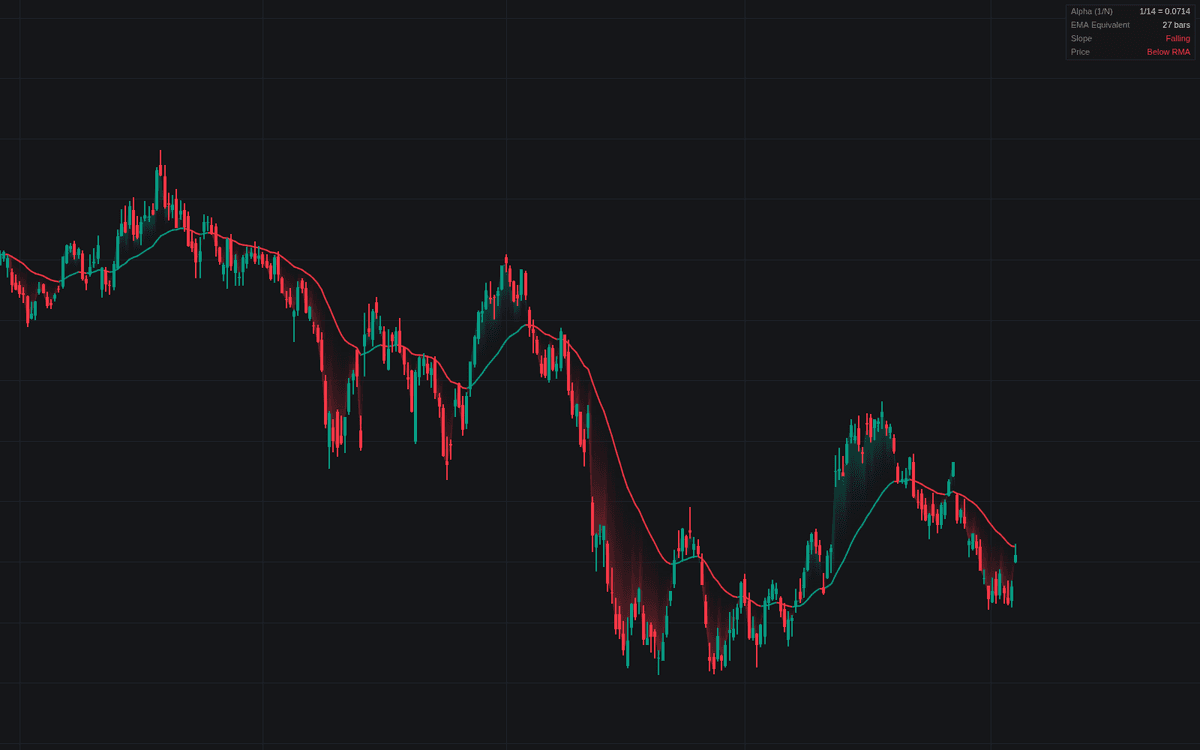

RMA plots Wilder's recursive smoother in its cleanest form: each bar blends 1/N of the newest price into (N-1)/N of yesterday's value, seeded with the mean of its first N inputs. The definitive build of the RMA treats its equivalences as first-class features: the dashboard reports the smoothing factor 1/N and the (2N-1)-bar EMA the line responds like, and overlays can add a same-length EMA and SMA plus the exact-alpha twin. Slope trend coloring and a price gradient fill carry the two classic bias reads.
How to Trade the RMA?
- Slope: the line colors bullish while rising and bearish while falling: the calm, rarely-flipping trend read, with alerts on each slope turn.
- Price side: the gradient fill shades bullish while price holds above the line and bearish below it, with alerts on both crossings.
- Crossover pair: enable the second RMA for a fast-against-slow pair built for patience; pair crossings carry their own alerts.
RMA Settings
- Source (default close): series the average smooths.
- RMA Length (default 14): N in the recursion; alpha is 1/N, smaller than an EMA's 2/(N+1) at the same stated length.
- Second RMA (default disabled) with Second RMA Length (default 50): the slower half of the crossover pair.
- EMA — Same Length, SMA — Same Length and Equivalent EMA (2N - 1) (each default disabled): comparison overlays.
- Show Dashboard (default enabled) with Location (default Top Right) and Size (default Small).
- Slope Trend Coloring (default enabled), Price / RMA Gradient Fill (default enabled), Price Crossing Markers (default disabled), Line Width (default 2); remaining inputs set colors.
Frequently Asked Questions

Original indicatorBuilt in-house by LuxAlgo
The Library is free. Quant makes it yours.
Pull any concept or indicator into Quant: rebuild it, retune it, or turn it into a backtested strategy of your own.