Round Numbers
 By LuxAlgoMay 18, 2026
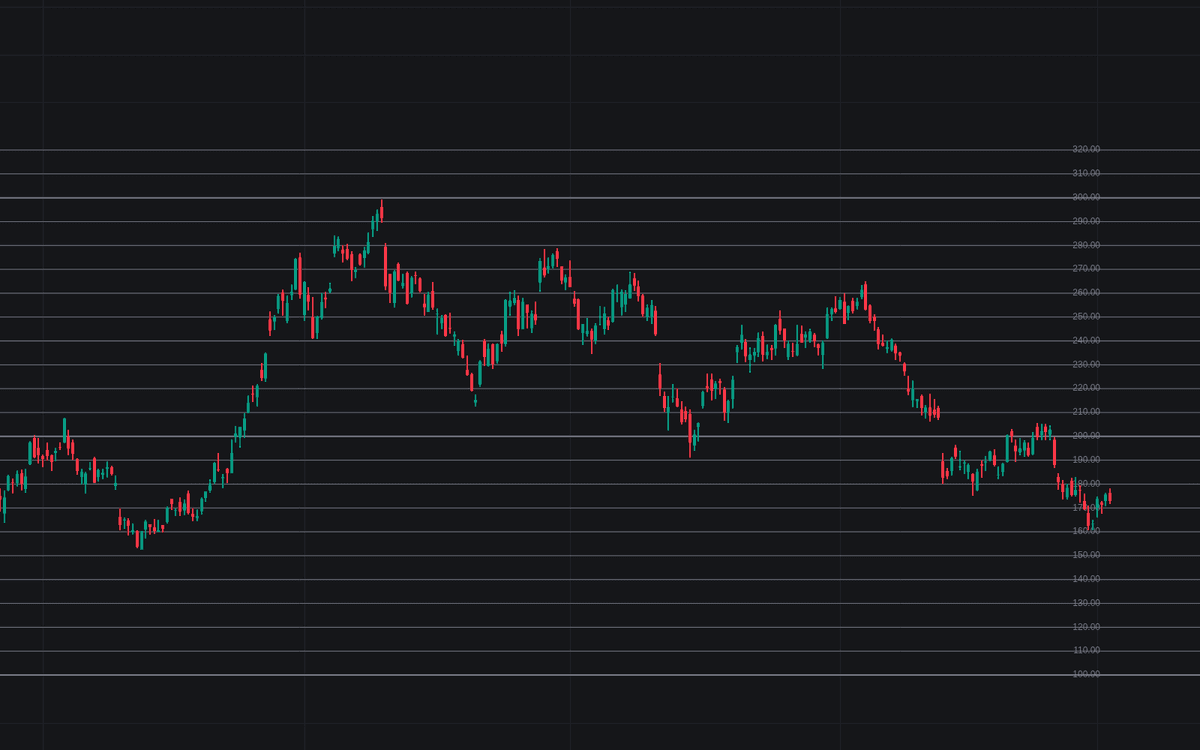

Round Numbers draws the psychological price grid with no manual work: big figures sized to the instrument, half levels between them, and the 25/75 quarter grid beneath those. The definitive clean build of round numbers sizes its step automatically (100-pip figures in forex, whole dollars on cheap stocks, larger powers of ten as prices grow) and manages density itself: the finest tiers thin first, so levels with the most trailing zeros survive, and every tenth figure draws one width thicker.
How to Trade the Round Numbers?
- Approach: price within the approach distance of the nearest figure arms the first alert, useful for tightening management into a magnet.
- Test: figures trade as zones, so the test alert fires when the bar's range reaches the zone around the figure: sweeps routinely overshoot by a few ticks.
- Break: a close through a figure fires the break alerts: stops beyond the figure can fuel continuation.
The grid needs no history to exist, making it a natural confluence layer under the rest of the levels family.
Round Numbers Settings
- Figure Step (default Auto (Instrument)): derives the big-figure step from the symbol; Manual Step Size (default 1) applies when the mode is Manual.
- Half Levels (50) (default enabled) and Quarter Levels (25 / 75) (default enabled): the minor tiers, dashed and dotted.
- Line Budget (default 40): most lines allowed across the visible range; quarters drop first, then halves, then figures.
- Approach Distance % (default 10): distance from the figure, as a share of the step, arming the approach alert.
- Figure Zone Width % (default 5): half-width of the zone treated as the figure itself.
- Style inputs set tier colors, Figure Line Width (default 1), Figure Labels (default enabled) and Line Extension (default Right).
Frequently Asked Questions

Original indicatorBuilt in-house by LuxAlgo
The Library is free. Quant makes it yours.
Pull any concept or indicator into Quant: rebuild it, retune it, or turn it into a backtested strategy of your own.