All indicators

RSI Prediction by Range Segmentation

By LuxAlgoMar 12, 2026

Static chart image
ForecastingOscillators

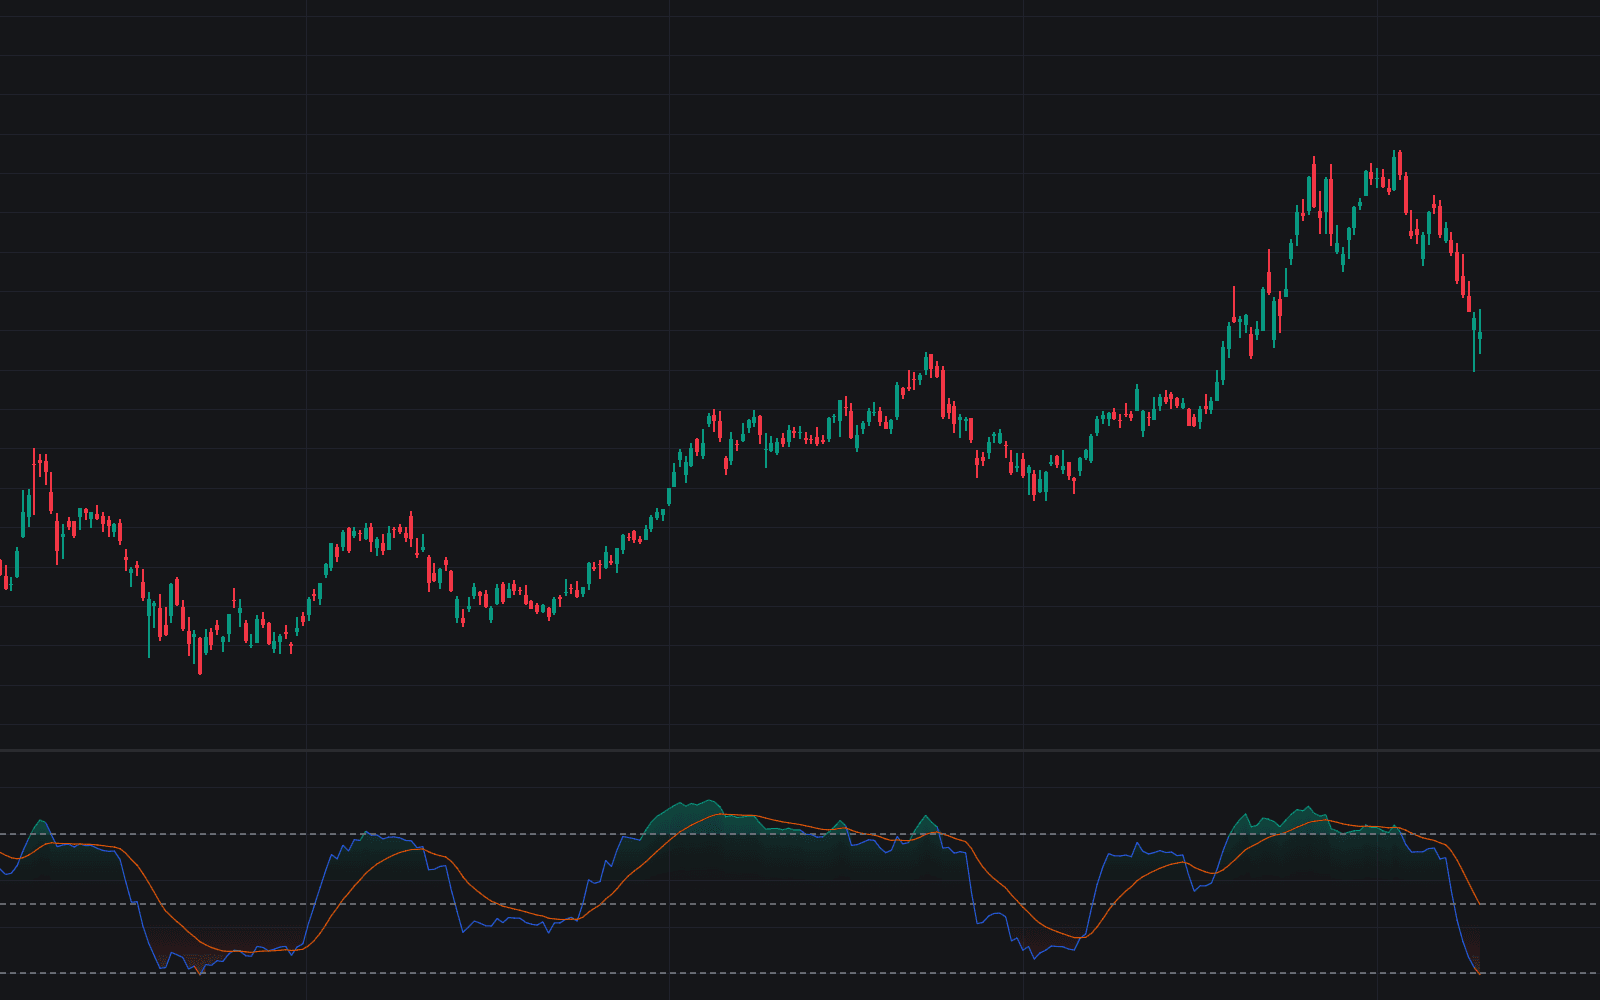
The RSI Prediction by Range Segmentation indicator is a momentum forecasting tool that helps traders anticipate how the Relative Strength Index may evolve next based on how RSI behaved historically from similar starting conditions. Instead of treating RSI as a static overbought or oversold oscillator, this trading indicator builds a data-driven RSI forecast by grouping past momentum states into segments and averaging what happened afterward. The result is a cleaner way to study momentum continuation, exhaustion, and potential reversals using historical RSI behavior.

How to Use the RSI Prediction by Range Segmentation Trading Indicator

This RSI trading indicator divides the full RSI scale from 0 to 100 into horizontal range segments and then compares the current RSI reading to past moments when RSI started in the same segment. Once a match is found, the script averages the forward path of those historical cases and projects a likely future RSI trajectory.

This makes the tool useful for traders who want more context than a standard RSI reading alone can provide. Rather than only asking whether RSI is above 70 or below 30, traders can study how momentum has typically developed after reaching a similar RSI zone in the past.

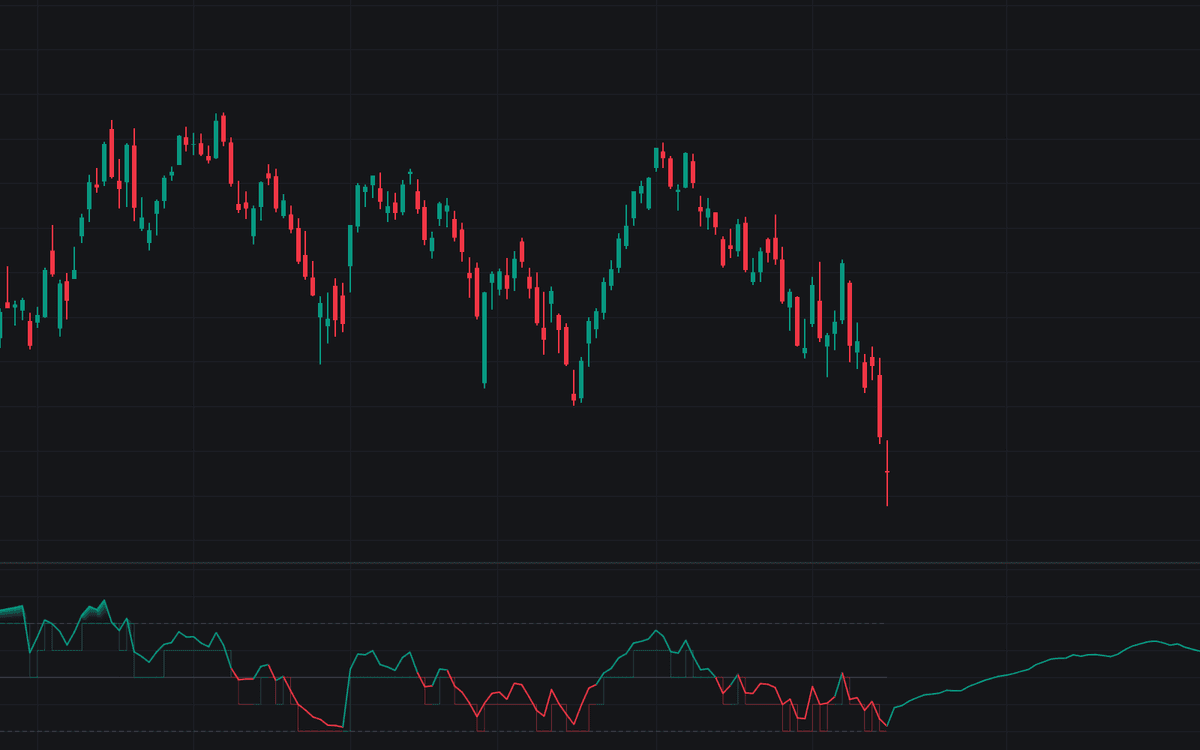
The forecast is displayed as a dynamic polyline that extends forward from the current RSI value. This allows traders to visually estimate whether momentum may strengthen, stall, or reverse over the next several bars. At the same time, the live RSI line changes color depending on whether it is above or below the 50 level, making bullish and bearish conditions easier to interpret at a glance.

How Range Segmentation Improves RSI Analysis

The foundation of this indicator is its range segmentation model. The RSI scale is broken into configurable segments, such as 10 equal zones of 10 points each. Every segment represents a different momentum state, allowing the indicator to sort past RSI behavior into meaningful categories.

This structure can help traders think about RSI in a more nuanced way:

  • Lower segments can reflect weaker momentum or oversold conditions
  • Mid-range segments can represent neutral or transition states
  • Higher segments can show stronger bullish pressure or overbought conditions

Using more segments increases the precision of the historical matching because the script compares the current RSI to a narrower band of prior readings. However, more precision usually means fewer samples inside each bucket. Using fewer segments creates broader categories and typically increases the number of matching historical examples, which can produce a smoother but less specific forecast.

A step-line is also plotted to show the base of the active segment, helping traders quickly see which momentum bucket is currently being used for the prediction.

How the RSI Forecast Works

The forecast is only drawn on the latest bar, where it retrieves stored historical outcomes for the current RSI segment and calculates their average forward path. This creates a probabilistic RSI projection rather than a guaranteed prediction, which is an important distinction for real trading use.

In practice, this means the indicator is not trying to guess the future with certainty. It is showing how RSI has tended to behave after arriving at the current momentum zone in the past. That makes it useful for:

  • identifying likely momentum continuation
  • spotting possible mean-reversion setups
  • anticipating overbought or oversold tests
  • improving timing for entries and exits
  • adding confirmation to a broader trading strategy

The forecast color is also adaptive. When the projected endpoint is above the current RSI, the forecast is shown in a bullish color. When the projected endpoint is below the current RSI, it switches to a bearish color. This instantly tells traders whether the model is leaning toward strengthening or weakening momentum.

Reading Overbought and Oversold Conditions More Clearly

To make extreme RSI conditions easier to spot, the indicator includes gradient fills around user-defined overbought and oversold levels. These visual fills help traders see when momentum is entering stretched territory without needing to focus only on raw numbers.

When RSI rises above the overbought threshold, a bullish gradient highlights the area between RSI and that level. When RSI falls below the oversold threshold, a bearish gradient appears instead. This creates a more intuitive view of momentum extremes and can help traders judge whether the forecast is pushing deeper into an extreme or beginning to pull away from it.

For traders using RSI in trend-following or reversal strategies, these fills can be especially useful because they provide additional visual context around momentum pressure and possible exhaustion.

How This RSI Forecasting Model Works Behind the Scenes

This trading indicator uses User-Defined Types (UDTs) to organize and store collections of historical RSI sequences. These sequences are saved as momentum segments inside dedicated data structures, allowing the script to build a reusable library of past RSI behavior.

Each time a new bar closes, the script looks back over a pattern of a chosen length and stores that sequence according to the RSI segment where it began. In other words, the anchor point of the pattern determines which bucket it belongs to. Over time, this creates a categorized database of forward RSI outcomes for different momentum states.

When the script reaches the real-time bar, it accesses the historical bucket that matches the current RSI segment, retrieves the stored examples up to the selected history limit, and averages them to generate the forecast path.

This design makes the indicator both structured and efficient. Instead of recalculating everything from scratch, it organizes momentum history in a way that makes repeated forecasting possible while maintaining a deeper sample of historical RSI behavior.

Indicator Settings

General Settings

  • Historical Limit: Controls how many historical RSI segments are stored for each range bucket. A larger value gives the forecast a broader sample size and can produce a smoother average path.
  • Forecast Length: Sets how many bars into the future the RSI prediction extends. This also defines the size of the historical patterns that are being recorded and averaged.
  • Range Segments: Determines how many sections the 0-100 RSI scale is divided into. Higher values create more precise momentum categories, while lower values create broader groupings.
  • RSI Length: Defines the lookback period used for the RSI calculation itself. Shorter values make RSI more reactive, while longer values smooth it out.

Momentum Levels

  • Overbought Level: The RSI threshold above which the market is considered overbought, triggering the bullish gradient fill.
  • Oversold Level: The RSI threshold below which the market is considered oversold, triggering the bearish gradient fill.

Color Settings

  • Bullish Color: Used for the RSI line when RSI is above 50, the bullish forecast path, and the overbought gradient fill.
  • Bearish Color: Used for the RSI line when RSI is below 50, the bearish forecast path, and the oversold gradient fill.
  • Level Color: Sets the color of the horizontal reference levels, including overbought, oversold, and the center 50 line.

Why Traders Use the RSI Prediction by Range Segmentation Indicator

Many traders use RSI as a simple momentum oscillator, but this indicator expands it into a more advanced trading tool by adding historical pattern forecasting. That makes it useful for traders who want to go beyond static threshold readings and analyze how momentum is likely to evolve from the current RSI state.

This can be valuable for several trading styles:

  • Swing traders can use it to estimate whether momentum is likely to continue or fade over the next series of bars.
  • Day traders can combine the forecast with market structure, support and resistance, or trend filters to improve timing.
  • Reversal traders can use projected RSI path behavior to watch for likely exhaustion zones.
  • Trend traders can use the 50-line bias and projected continuation path as confirmation during pullbacks.

As with any momentum forecasting tool, it works best when used alongside price action, trend context, and broader confluence rather than in isolation.

FAQ

What does the RSI Prediction by Range Segmentation indicator do?

It projects a future RSI path by averaging historical RSI sequences that started from a similar RSI range segment. This gives traders a probabilistic view of how momentum may behave next.

Is this an RSI trading strategy or just a trading indicator?

It is primarily a trading indicator, but it can be integrated into a broader trading strategy for entries, exits, confirmation, or momentum filtering.

How is this different from a standard RSI indicator?

A standard RSI indicator shows the current momentum reading. This version adds a forward-looking forecast based on historical RSI behavior from similar momentum zones.

Does the forecast guarantee where RSI will go?

No. It is a probabilistic projection based on historical averages, not a certainty. It should be used as context, not as a standalone signal.

How should I choose the number of range segments?

Fewer segments create broader matching and usually more historical samples. More segments create tighter matching and more precision, but with fewer samples. The best setting depends on how specific or smooth you want the forecast to be.

How do I access RSI Prediction by Range Segmentation?

You can get access on the LuxAlgo Library for charting platforms like TradingView, MetaTrader (MT4/MT5), and NinjaTrader for free.

Free indicator

Get free access to this indicator on the platforms below.

TradingView
NinjaTrader
MetaTrader 4/5

Unlock the entire LuxAlgo Library

Every indicator, every strategy, full charts, and complete access to Quant — our AI agent.