Concept
RSI Range Rules
RSI Range Rules, also known as 50-midline regime, bull 40–90 / bear 10–60 range shift, are Momentum & Oscillators concepts. The Library holds 1 implementation, a working definition you can pull into Quant.
Top RSI Range Rules indicator
The top custom implementation, built on the original standard RSI Range Rules formula.
1 total
Want to trade RSI Range Rules? The implementation below is one prompt away from a backtested strategy in Quant.
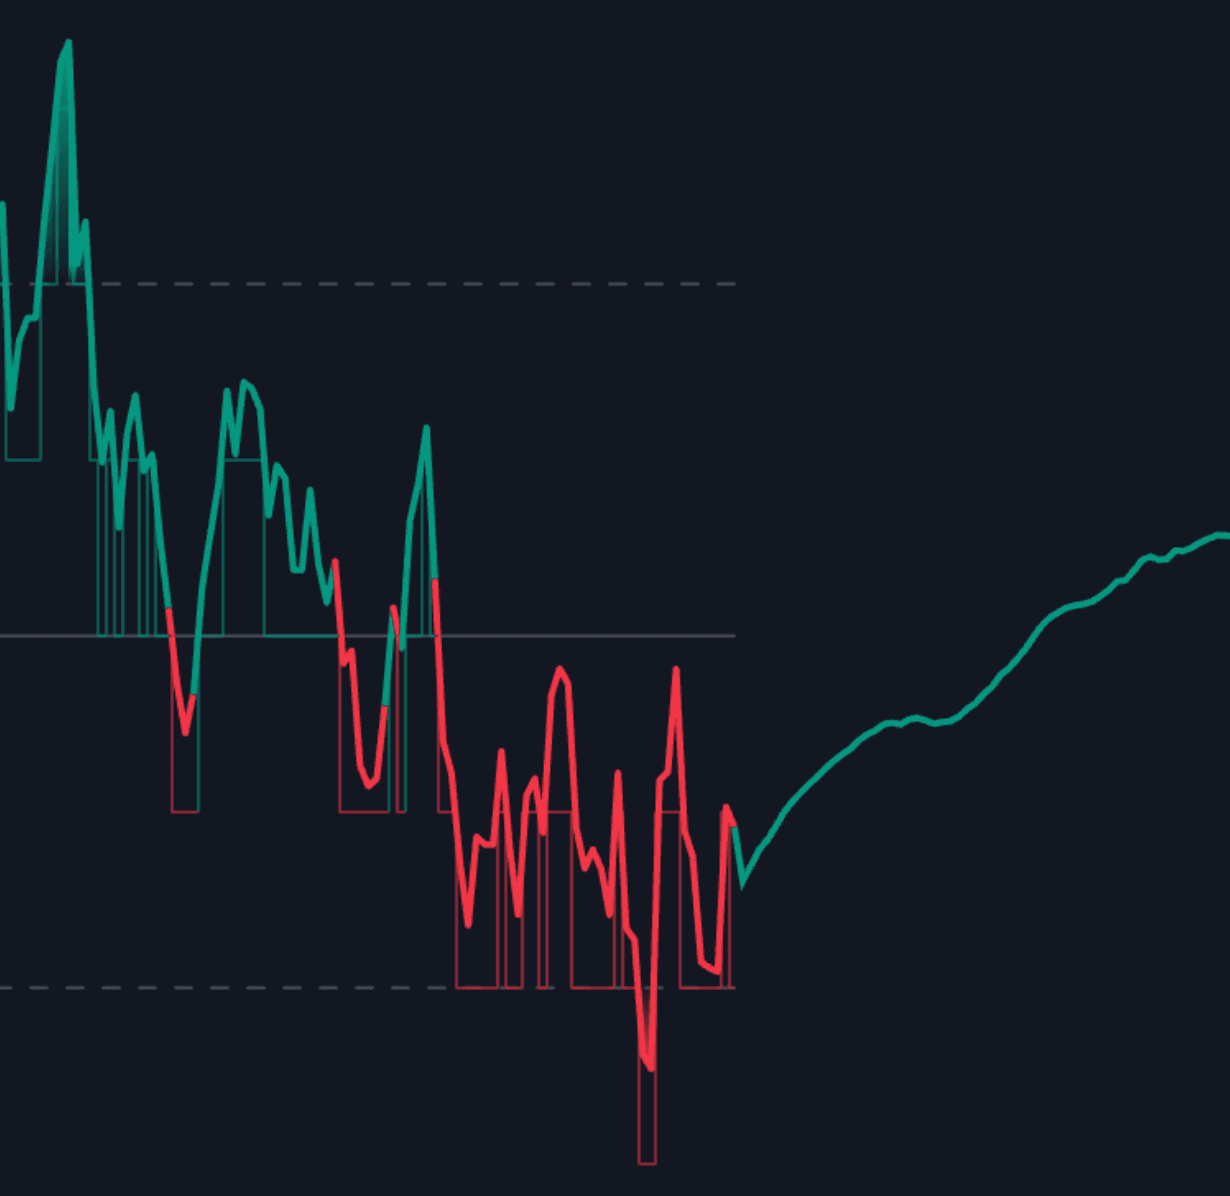
What are RSI Range Rules?
RSI range rules formalize the observation that RSI does not use its 0-100 scale symmetrically: it shifts its operating range with the trend regime. In the formulation popularized by Constance Brown, building on Andrew Cardwell's work, bull-market RSI tends to travel roughly 40-90 and finds support in the 40-50 band on pullbacks, while bear-market RSI tends to hold roughly 10-60 with rallies capped in the 50-60 band. The classic 70/30 lines become regime-dependent: in a healthy uptrend, tagging 70 is normal strength and a true oversold print may never arrive.
The framework is usually credited to Andrew Cardwell, the RSI specialist whose courses for traders taught range analysis alongside the positive and negative reversal signals he identified. Constance Brown, who studied Cardwell's work, gave the ranges wide circulation in Technical Analysis for the Trading Professional (1999), arguing that oscillators rarely travel their full theoretical scale and instead operate inside regime-dependent bands. Her bull and bear ranges became standard RSI vocabulary, even where later authors quote slightly different boundaries.
The rule set has two working parts. First, read the regime from where RSI finds support and resistance, with the 50 midline as the coarse divider, the familiar centerline-regime idea upgraded to zones. Second, watch for range shifts: a bull-range market losing the 40 area, or a bear-range market reclaiming and holding above 60, is early evidence that the trend regime itself is changing.
Range rules answer the oldest complaint about RSI, that it stays overbought through entire uptrends and punishes anyone mechanically fading strength. Under the range reading, a sticky 70-plus RSI is information: it identifies the regime. The rules also reorder which signals deserve trust. In a bull range, bearish divergences against the 40-50 support zone fail often, while hidden divergence, closely related to Cardwell's positive and negative reversals, points with the regime and tends to age better. The zones are observed tendencies, valuable mostly because they force the regime question before any oscillator signal is taken.
How to identify the current RSI range regime
Use a 14-period RSI on a swing timeframe, daily or higher, with several months of swings in view.
- 1Mark the RSI peaks and troughs that line up with genuine price swings, not every wiggle.
- 2Read the troughs: pullbacks repeatedly bottoming in the 40-50 band argue a bull range; troughs stretching toward 20 argue a bear range.
- 3Read the peaks: rallies stalling in the 50-60 band fit a bear range; peaks pressing past 70 fit a bull range.
- 4If neither side is clean, classify the chart as rangebound and fall back to classic 70/30 readings until a regime asserts itself.
- 5Watch for the shift: a bull-range chart losing the 40 area, or a bear-range chart holding above 60, flags a possible regime change to confirm against price structure.
How it's calculated
Standard RSI read against regime-dependent operating ranges, where the zone that contains RSI identifies bull or bear conditions.
The 40 to 90 and 10 to 60 ranges follow Constance Brown's Technical Analysis for the Trading Professional and are empirical guides, not exact constants.
A regime shift is suggested when RSI breaks and then holds outside the range that previously contained it.
The rules assume Wilder smoothing; SMA or EMA based RSI variants shift the effective band levels slightly.
How traders use it
- As a trend filter: take longs only while RSI keeps respecting the bull range and shorts only in the bear range, which keeps a mean-reversion oscillator from arguing with the trend.
- As a pullback map: in an established uptrend, RSI dipping into 40-50 marks the zone where bull-regime pullbacks tend to stabilize, a place to hunt entries alongside price structure rather than fear a reversal; nothing about the zone is guaranteed.
- As a regime-change alarm: a decisive break of the established range is treated as earlier evidence of trend change than price alone; the surrounding Constance Brown RSI studies build a larger toolkit on this idea.
- As a divergence filter: regime placement decides which signals deserve trust, with counter-regime divergences demanding price confirmation and pro-regime continuation reads given more benefit of the doubt.
- As a portable template: similar zone logic is applied to the stochastic oscillator, and adaptive RSI variants automate the band shifts that Brown's rules ask the analyst to judge by eye.
RSI Range Rules vs related frameworks
Overbought/oversold: The classic read treats 70/30 as reversal zones everywhere. Range rules make those levels conditional: 70-plus is routine in a bull range and rare in a bear range. One framework fades extremes; the other uses where extremes sit to define the trend.
Hidden Divergence: Cardwell's positive and negative reversals map closely onto hidden divergence and fire as single events; range rules describe the standing regime around those events. They grew from the same body of RSI work and are usually applied together.
Adaptive/dynamic RSI: Adaptive variants move the indicator's bands with volatility so the chart adjusts for you. Range rules keep the fixed 0-100 scale and move the interpretation instead. Same goal, opposite division of labor.
Concept family
Momentum & Oscillators
91 concepts mapped · 91 in the Library
RSI Range Rules FAQ
Turn RSI Range Rules into a trading strategy.
Take the implementation from this page into Quant, then build on it, backtest it on real data, and keep refining it in conversation.