All indicators

RSI Regime Filter

By LuxAlgoAug 4, 2026

Static chart image
OscillatorsDivergences

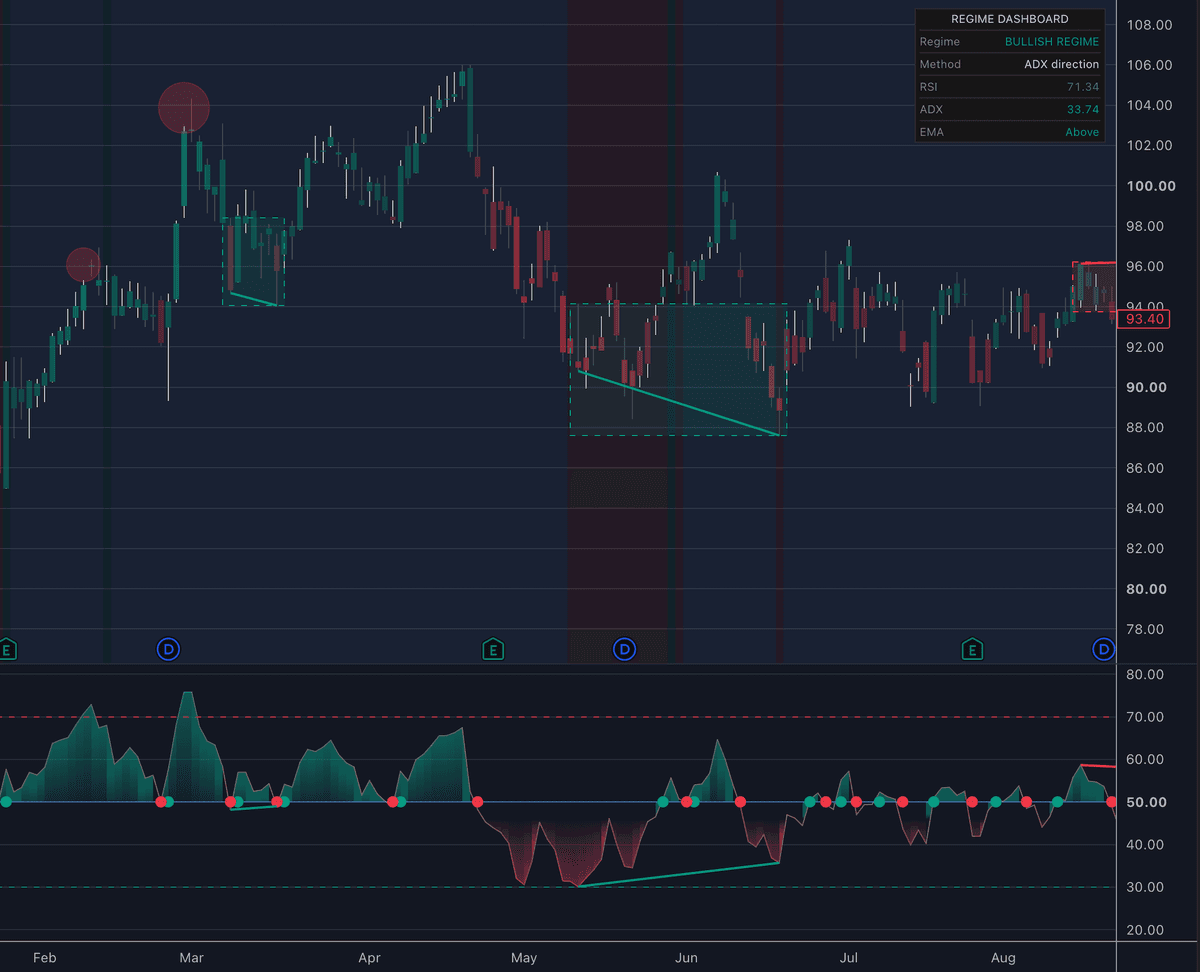
The RSI Regime Filter indicator serves as a robust technical analysis tool designed to identify RSI based trade signals while filtering them against broader market regime conditions to improve trade precision. By combining traditional momentum analysis with dynamic market environment classification, this tool helps traders isolate high probability divergence setups and overbought or oversold entries, effectively reducing false signals during strong trending markets.

Usage

The RSI Regime Filter is designed for traders who want to distinguish between ranging environments where oscillators perform best and trending environments where they may be prone to failure.

Detecting Divergences

The script automatically identifies bullish and bearish divergences based on RSI peaks and troughs. You can use these to spot potential trend reversals. By enabling the RSI Regime Filter, the script will only plot these divergences when the selected regime method detects a neutral or ranging market, preventing trades against the primary trend.

Identifying Market Regimes

The indicator provides four methods to classify the market: RSI level, EMA trend, ADX direction, or a Composite vote. Traders can monitor the dashboard to see which regime is currently active. For example, using the ADX method helps you avoid overbought or oversold entries when the ADX value suggests a strong trend is already underway.

Volume Based Entries

The indicator includes volume bubbles that appear when the RSI enters an overbought or oversold zone. The size of these bubbles is determined by the relative volume, giving you an immediate visual cue regarding the strength of the move.

Details

The core of the RSI Regime Filter lies in its multi-layered logic. The script calculates the standard Relative Strength Index and integrates it with various market filters.

The regime engine calculates the state of the market by comparing price to moving averages, evaluating DMI components to derive the ADX, and assessing RSI positioning. When the RSI Regime Filter is enabled, the script validates every signal against these conditions. If the market is determined to be in a strong trend rather than a range, the script suppresses signals that might otherwise lead to "catching a falling knife" or fading a breakout.

Furthermore, the script provides a visual dashboard on the chart, summarizing the current RSI value, ADX strength, and EMA positioning, ensuring traders have all the necessary context in one view.

Settings

RSI

  • RSI length: Sets the number of bars used for the RSI calculation.
  • Overbought level: Defines the RSI threshold for the overbought zone.
  • Oversold level: Defines the RSI threshold for the oversold zone.
  • Shade RSI zones: Toggles the background shading in the RSI indicator pane.

Divergences

  • Pivot left bars: Number of bars to the left required to confirm a price pivot.
  • Pivot right bars: Number of bars to the right required to confirm a price pivot.
  • Require RSI extreme: If enabled, only accepts divergences that occur when the RSI is in an overbought or oversold state.
  • Show divergence boxes: Draws visual boxes on the chart to highlight the candles involved in a divergence.

Trend changes

  • Color candles by trend strength: Adjusts candle colors based on how far the RSI is from the 50 level.
  • Show 50 level markers: Displays circles on the RSI pane when the RSI crosses the midpoint.

Volume bubbles

  • Show OB/OS bubbles: Displays circles on the chart when the RSI hits extreme levels.
  • Volume average length: The lookback period used to calculate the relative volume ratio.

Market regimes

  • Regime method: Selects the logic used to define the market as Bullish, Bearish, or Neutral.
  • EMA length: Length used for the EMA trend calculation.
  • DMI length: Length for the Directional Movement Index.
  • ADX smoothing: Smoothing factor for the ADX line.
  • ADX trend threshold: The level at which the ADX confirms a trending market.
  • RSI Regime Filter: Toggles the filtering of signals based on the active regime.
  • Color chart by regime: Changes the chart background color to match the market state.

Style

  • Bullish/Bearish/Neutral colors: Customizes the aesthetic theme of the indicator components.

FAQ

How do I access the RSI Regime Filter? You can get access on the LuxAlgo Library for charting platforms like TradingView, MetaTrader (MT4/MT5), and NinjaTrader for free.

Can I use this for day trading? Yes, the script is highly effective on lower timeframes for identifying exhaustion points during sideways sessions.

What is the best way to use the Composite regime? The Composite method is generally the most reliable as it requires a consensus across multiple indicators, providing a more balanced view of the market environment.

Free indicator

Get free access to this indicator on the platforms below.

TradingView
NinjaTrader
MetaTrader 4/5

The Library is free. Quant makes it yours.

Pull any concept or indicator into Quant: rebuild it, retune it, or turn it into a backtested strategy of your own.