Concept
Trend/range Classifiers
Trend/range Classifiers are Meta & Composition concepts. The Library holds 1 implementation, a working definition you can pull into Quant.
Top Trend/range Classifiers indicator
The top custom implementation, built on the original standard Trend/range Classifiers formula.
1 total
Want to trade Trend/range Classifiers? The implementation below is one prompt away from a backtested strategy in Quant.
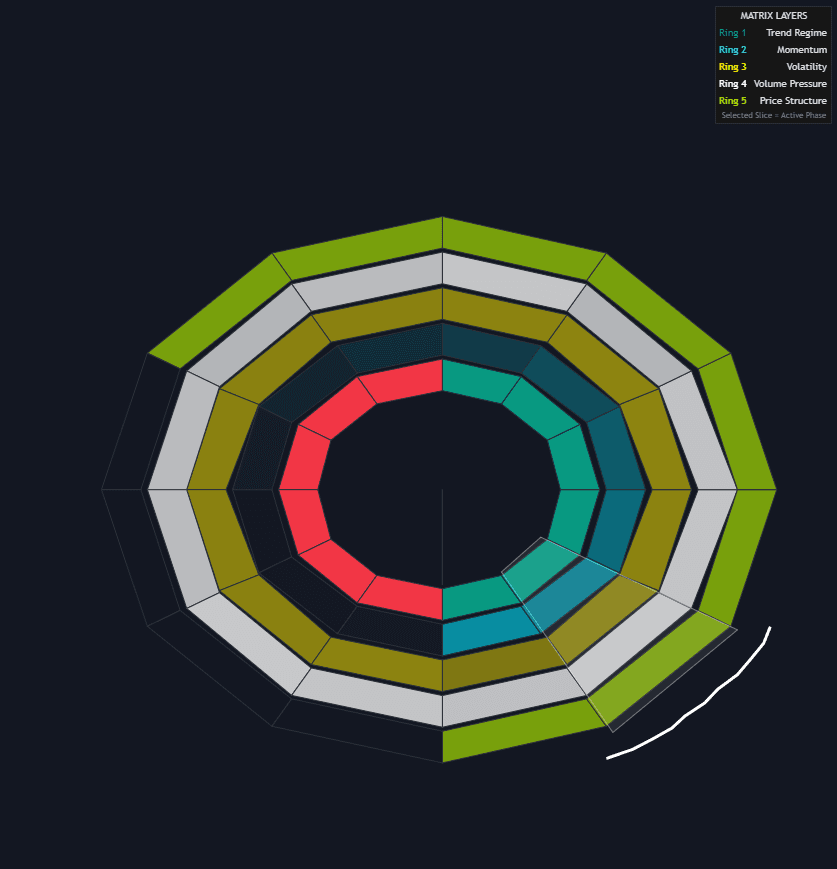
What are Trend/range Classifiers?
A trend/range classifier is any rule or model that labels the market's current state, trending or ranging, so a system can decide which playbook applies. The simplest are thresholds on directional-efficiency measures: ADX above a chosen level, the Choppiness Index below a chosen level, or the Kaufman efficiency ratio (net price movement divided by the sum of absolute bar-to-bar movements, a value between zero and one) near the top or bottom of that range. Richer versions add moving-average slope and separation, band width, autocorrelation, or Hurst-exponent estimates, and machine-learning variants group such features into regimes with k-means or hidden Markov models. The output is a discrete label, sometimes with direction attached: bull trend, bear trend, range.
Classification matters because most techniques are regime-specific: trend-following bleeds through ranges and mean reversion gets run over by trends, so the label determines which edge is even in play. The limits deserve equal billing. Every input is computed from past bars, so labels lag; markets spend long stretches near the boundary, where a noisy measure oscillates around its threshold; and regimes are only unambiguous in hindsight. Practical classifiers accept lateness in exchange for stability, using hysteresis (a different threshold for entering a state than for leaving it) or a minimum dwell time before the label is allowed to flip.
In practice most classifiers combine a few features rather than trusting one line. A typical recipe computes an efficiency measure, a volatility-normalized moving-average separation, and a band-width reading, then requires agreement before declaring a trend, in the spirit of confluence and scoring systems. Published tools package the same idea in different wrappers: LuxAlgo's Market State Matrix scores several state dimensions side by side, its Hidden Markov Model Market Regimes fits a statistical state model to price behavior, and LazyBear's Range Identifier flags rotational stretches directly on the chart. Under the hood each converts continuous measurements into a discrete label through thresholds, dwell rules, or fitted transition probabilities.
Two properties decide whether a classifier helps or hurts. The first is stability: a label that flips every few bars is worse than no label, because every flip re-routes the system into a different playbook, so designers deliberately trade recognition speed for persistence. The second is honesty about the middle: markets spend much of their time in transitional states that belong to neither camp, and forcing a binary answer there manufactures errors. Classifiers that expose their raw score, or an explicit neutral state, show how confident the label actually is. None of this makes the label predictive; it describes the recent past, and the regime can change on the bar after it is read.
How to identify market regime with a trend/range classifier
A classifier is assembled and calibrated rather than read off the chart, so identification is mostly about building a label you can trust and checking it against price behavior you can see.
- 1Match the timeframe to the strategy: compute the label on the horizon you actually trade, since a daily classifier says nothing about the hourly state; top-down analysis can layer a higher-timeframe label on top as context.
- 2Pick two or three features that measure different things, for example an efficiency ratio for directionality, band width for volatility shape, and moving-average separation for persistence; near-duplicate inputs add confidence without adding information.
- 3Set thresholds with hysteresis: a stricter bar for entering the trending state than for staying in it, so borderline readings do not toggle the label every bar.
- 4Add a minimum dwell time before the label may flip again, and consider an explicit neutral state for readings near the boundary rather than forcing every bar into trend or range.
- 5Validate visually and statistically: scroll the labeled history and check that obvious trends and ranges carry the right label, then split backtest results by label and confirm the edge actually concentrates where the classifier says it should.
How traders use it
- As a strategy switch: breakout and trend-following entries are enabled only under the trending label, while fades at the edges of a trading range are enabled only under the ranging label; strategy switching and rotation generalizes the idea.
- As a parameter controller: one strategy runs everywhere, but its lookbacks, stop distances, and targets shift with the label, the territory of adaptive parameterization.
- As a stand-down filter: an explicit third state for ambiguous readings keeps the system flat or small when the classifier itself is unsure, which is often exactly where both playbooks lose.
- As a research lens: splitting performance statistics by regime label shows whether an edge exists everywhere or only inside one state, which changes how it should be deployed and sized.
- As an alert scaffold: regime flips are natural notification events, and wiring the label change into alerts and webhooks lets a trader or an automated system re-evaluate exposure when the state changes instead of monitoring continuously.
Trend/range Classifiers vs other regime tools
Trend Regime Label: A trend regime label answers "which way": up, down, perhaps flat, usually from moving-average logic. A trend/range classifier answers "what kind of market": directional or rotational. Many systems run both, one to pick the playbook and one to pick the side.
Volatility Regime Switches: Volatility regimes sort by how much price moves, not how efficiently it travels. Quiet trends and violent ranges both exist, so volatility level and trend/range state are different axes; conflating them misclassifies exactly the markets that hurt most.
Hidden Markov / Markov-switching Regimes: Markov-switching models are one machinery for the job: they infer latent states and transition probabilities statistically. The classifier concept is broader and includes simple threshold rules; choosing the model trades transparency for flexibility.
Concept family
Meta & Composition
28 concepts mapped · 28 in the Library
Trend/range Classifiers FAQ
Turn Trend/range Classifiers into a trading strategy.
Take the implementation from this page into Quant, then build on it, backtest it on real data, and keep refining it in conversation.