Concept
Volatility Stop
Volatility Stop, also known as k×ATR, is a Risk, Sizing & Exits concept. The Library holds 1 implementation, a working definition you can pull into Quant.
Top Volatility Stop indicator
The top custom implementation, built on the original standard Volatility Stop formula.
1 total
Want to trade Volatility Stop? The implementation below is one prompt away from a backtested strategy in Quant.
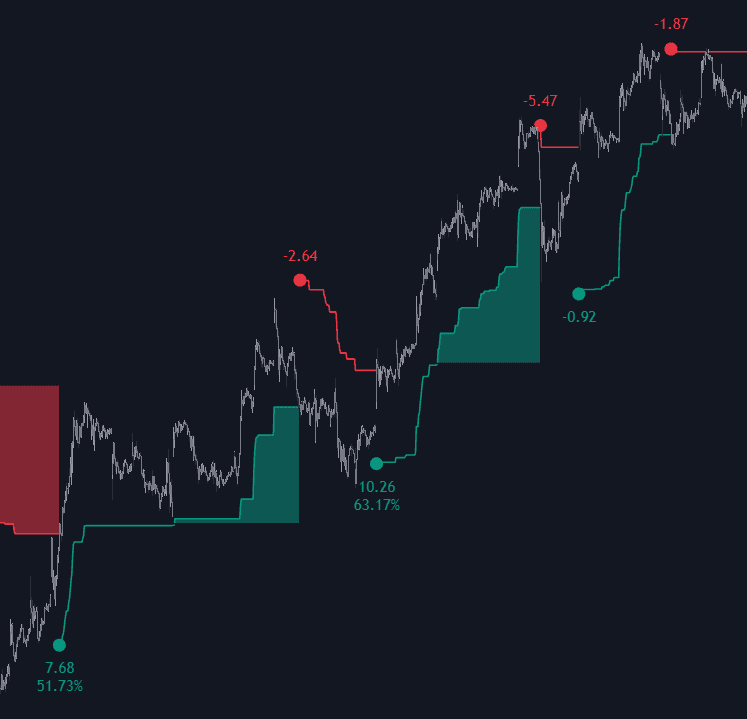
What is a Volatility Stop?
A volatility stop is a stop-loss placed a multiple of current volatility away from price, in practice almost always k times the average true range. Instead of a fixed dollar, tick, or percent distance, the offset breathes with the market: it sits farther away when ranges expand and tightens when they contract. In the trailed form the level recalculates as new bars print and ratchets in the trade's direction, never loosening, until price crosses it and the position exits.
The idea traces to Welles Wilder's 1978 volatility system, which trailed a stop a constant near 3 times a short average true range away from the trade's most favorable close. Later variants, one family within the broader trailing method taxonomy, differ mainly in the reference they offset from: the latest close, the bar midpoint (Supertrend), or the highest point since entry (the chandelier stop). Published multipliers commonly fall between 2 and 3.5, but no constant is canonical.
It matters because sizing the stop to volatility separates 'the trade is wrong' from 'the market is noisy.' A stop inside the instrument's normal bar-to-bar range will be hit regardless of direction; a k × ATR offset places the exit outside typical fluctuation for the chosen k. The same quantity also standardizes risk across instruments, which is why it often sets both the initial stop distance and, from there, the position size.
How to calculate a Volatility Stop
All variants share one construction; only the reference point, lookback, and multiplier differ.
- 1Compute the average true range over a chosen lookback. Published variants use windows from about 7 bars (Wilder's original) to 22 (a common chandelier setting); shorter windows react faster and jitter more.
- 2Multiply the ATR by a factor k to get the offset. A larger k means fewer whipsaw exits and more giveback; a smaller k the reverse.
- 3Subtract the offset from the reference price for longs, or add it for shorts. The reference is the main design choice: the latest close, the bar midpoint, or the highest high (or close) reached since entry.
- 4Ratchet and exit. Each bar, keep the tighter of the new level and the prior stop, and exit when price crosses it; decide in advance whether a close beyond the line or any intrabar touch triggers.
How it's calculated
A trailing stop placed k ATRs away from price that only ratchets in the trade's favor and flips direction when price crosses it.
Wilder's original volatility system measured k × ATR from the extreme close reached during the trade (the SIC) rather than ratcheting bar by bar; the result is nearly identical.
Chandelier Exit anchors the same offset to the highest high or lowest low of the last 22 bars with k = 3, and SuperTrend measures it from the bar midpoint (H_t + L_t) / 2.
How traders use it
- As the exit engine of trend-following systems: after a breakout or crossover entry, the position simply rides until the k × ATR line is crossed, replacing any fixed target.
- As the initial stop and the sizing input: placing the first stop k × ATR away keeps risk proportional to current conditions, and dividing per-trade risk by that distance yields the position size used in volatility-targeted sizing.
- As a regime filter: plotted continuously with a flip rule, the ratcheting line becomes a trend classifier, and which side price sits on gates other signals (the ATR trailing regime reading).
- As a way to de-cluster stops: a statistical offset is not anchored to visible swing points, so it often lands away from the obvious levels where resting stops pool (stop placement vs liquidity pools).
Volatility Stop vs related concepts
Chandelier Stop: A specific volatility stop: k × ATR trailed from the highest point reached since entry. The generic concept leaves the reference open; the chandelier pins it to the trade's extreme.
Supertrend: The same k × ATR offset measured from the bar midpoint, ratcheted, and drawn as a continuous line that flips bias on a cross: a volatility stop packaged as a regime indicator.
ATR Bands: Envelopes plotted k × ATR on both sides of price or an average for context. They track both directions at once and do not ratchet, so they frame volatility rather than enforce an exit.
Structure Stop: Anchored to a chart feature, typically the swing that would invalidate the idea, rather than a statistical distance. Volatility stops track noise width; structure stops track where the thesis fails.
Concept family
Risk, Sizing & Exits
37 concepts mapped · 37 in the Library
Volatility Stop FAQ
Turn Volatility Stop into a trading strategy.
Take the implementation from this page into Quant, then build on it, backtest it on real data, and keep refining it in conversation.