Concept
Trade Volume Index
Trade Volume Index is a Volume & Order Flow concept. The Library holds 1 implementation, a working definition you can pull into Quant.
Top Trade Volume Index indicator
The top custom implementation, built on the original standard Trade Volume Index formula.
1 total
The Trade Volume Index implementation below can become a backtested trading strategy — describe your rules and Quant writes the code.
What is the Trade Volume Index?
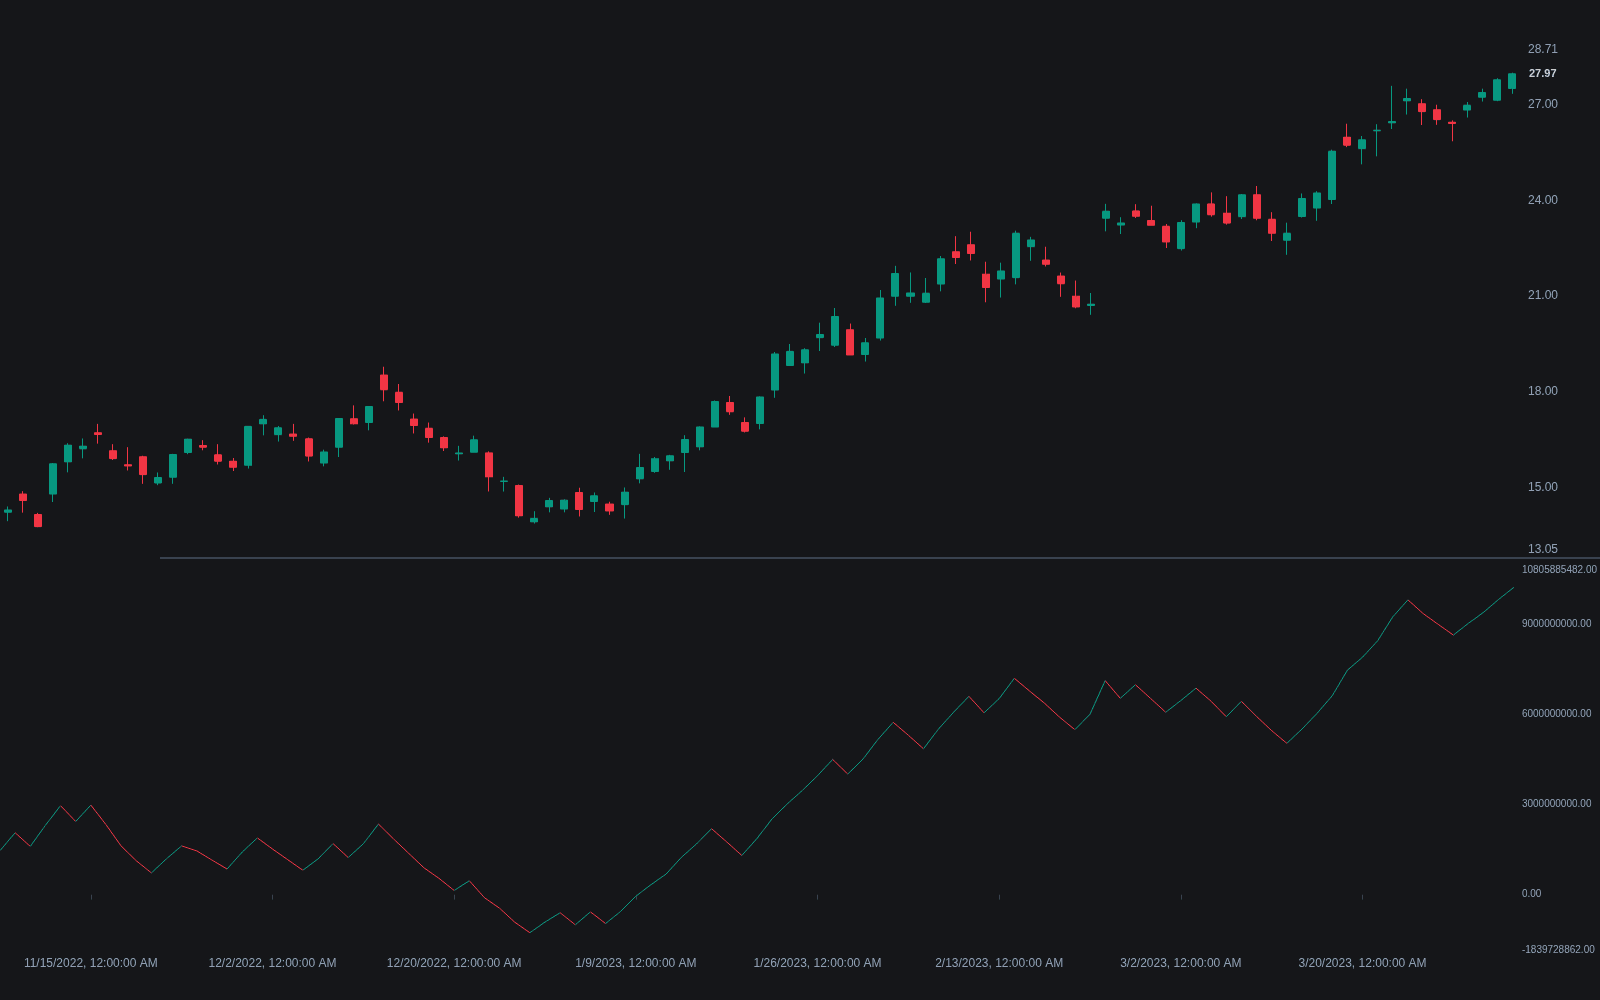
The Trade Volume Index (TVI) is a cumulative volume indicator designed for intraday and tick data that classifies each trade or price update as buying or selling based on the direction of the price change, then adds or subtracts its volume from a running total. Its defining feature is a minimum tick value threshold: only a price change larger than that threshold flips the classification, and changes at or inside the threshold inherit the direction of the last qualifying move. This makes TVI a rough intraday proxy for whether transactions are hitting the offer (accumulation) or the bid (distribution).
The indicator exists because close-based tools like On-Balance Volume lose their meaning on data where price barely changes between prints. Many intraday updates occur at unchanged or minimally changed prices, and the threshold-with-carryover rule is TVI's answer: sustained trading at the offer keeps accumulating volume on the buy side even when the printed price is static. In that sense TVI mechanizes a piece of classical tape reading, inferring aggression from which side of the spread trades occur on, without needing actual bid and ask data.
Traders care about TVI mostly on instruments and platforms where true bid-ask classified data is unavailable. A rising TVI during a flat price period suggests quiet accumulation that may precede an upside break; a falling TVI into support suggests distribution. Where genuine order flow data exists, measures built on actual trade-side classification, such as volume delta, are more direct.
How it's calculated
TVI is a running total whose direction depends on price change relative to a minimum tick value.
TVI was designed for tick data; applying it to time-based bars uses each bar's close and volume and loses most of the intent. The starting value is arbitrary, so only slope and divergence are meaningful.
How traders use it
- Reading flat markets: a steadily rising TVI while price moves sideways is the classic accumulation read, suggesting buyers are absorbing supply at the offer before a potential markup.
- Divergence at highs and lows: price pushing to a new intraday extreme while TVI fails to follow suggests the move lacks aggressive participation and is prone to fading.
- Breakout qualification: some intraday traders require TVI to be making new highs alongside price on an upside breakout before trusting it.
- Limitations: the direction inference is a heuristic, not a measurement; trades inside the threshold are simply assumed to continue the prior side, which can misclassify long stretches of activity. On instruments with real bid-ask trade data, delta-based tools supersede it.
Trade Volume Index vs related cumulative measures
On-Balance Volume: OBV classifies each bar by close-to-close direction with no threshold, suited to daily data. TVI adds the minimum tick threshold and carryover rule so it stays meaningful on tick and intraday data full of unchanged prints.
Cumulative Volume Delta: CVD sums actual buy volume minus sell volume classified against the real bid and ask. TVI approximates the same idea from price changes alone, so it is the fallback when true trade-side data is unavailable.
Accumulation/Distribution Line: The A/D Line splits each bar's volume proportionally by where the close sits in the range. TVI is all-or-nothing per tick, which suits transaction-level data better than bar-level data.
Concept family
Volume & Order Flow
88 concepts mapped · 88 in the Library
Trade Volume Index FAQ
Turn Trade Volume Index into a trading strategy.
Take the implementation from this page into Quant, then build on it, backtest it on real data, and keep refining it in conversation.