Concept
Traders Dynamic Index
Traders Dynamic Index is a Momentum & Oscillators concept. The Library holds 1 implementation, a working definition you can pull into Quant.
TDI
Top Traders Dynamic Index indicator
The top custom implementation, built on the original standard Traders Dynamic Index formula.
1 total
The Traders Dynamic Index implementation below can become a backtested trading strategy — describe your rules and Quant writes the code.
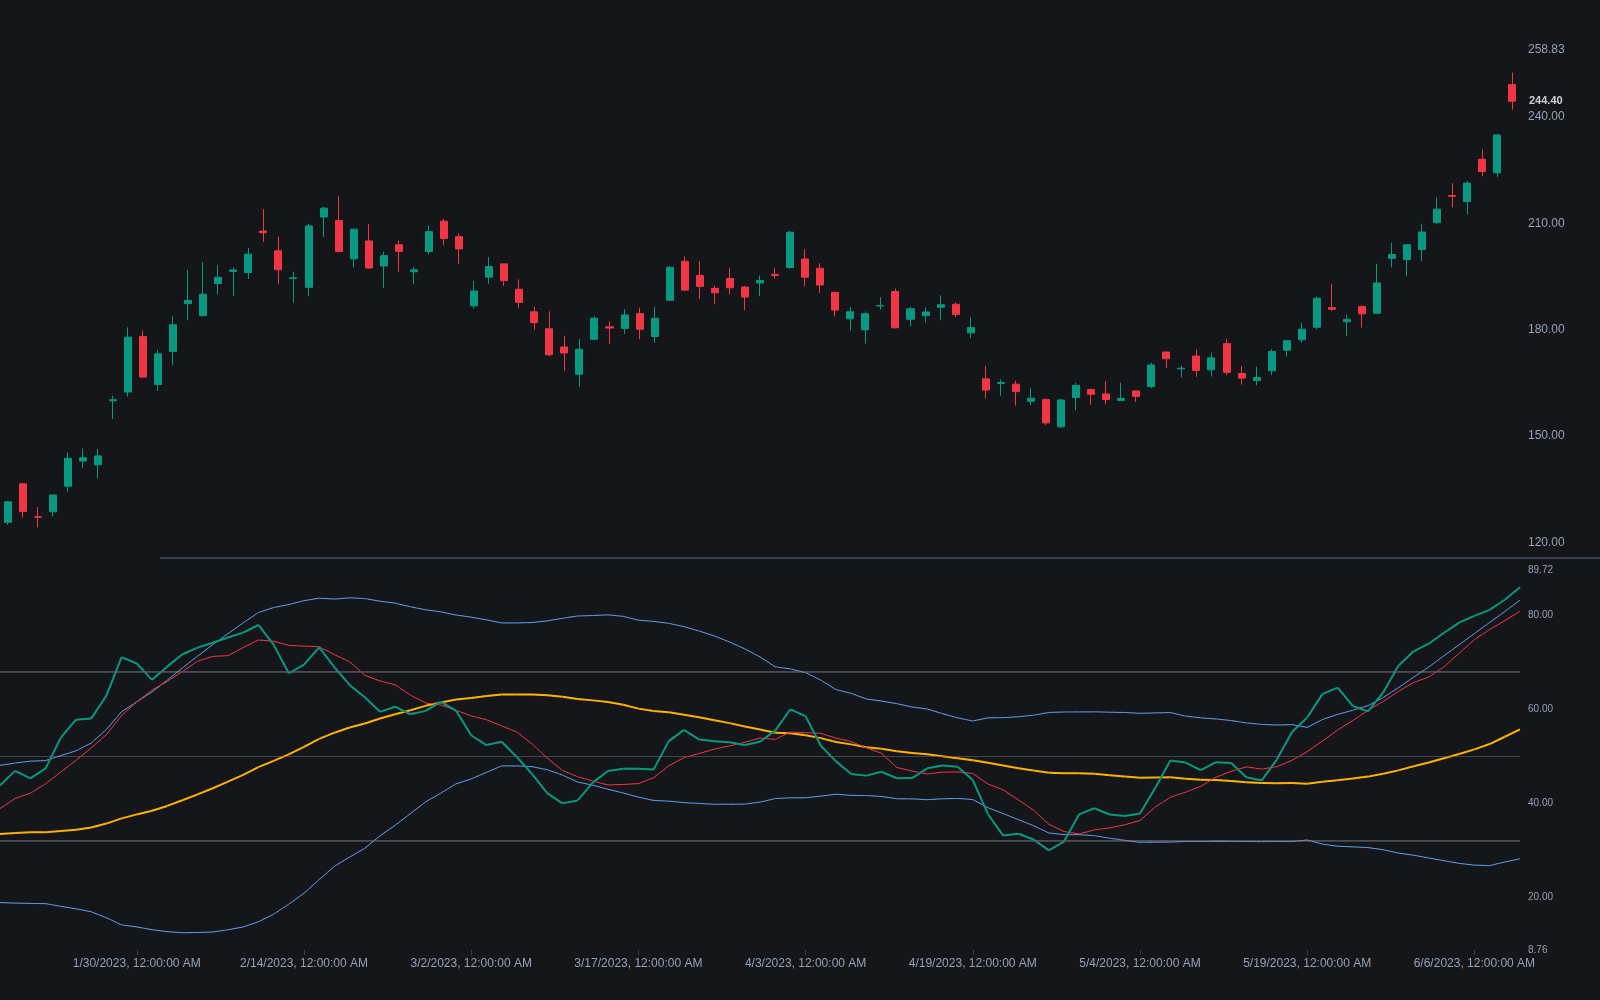
What is the Traders Dynamic Index?
The Traders Dynamic Index (TDI) is a composite momentum indicator, developed by Dean Malone, that layers several readings into one pane. Its base is an RSI, commonly 13-period. On top of that it plots a fast moving average of the RSI (the price line, often 2 periods), a slower one (the signal line, often 7), and Bollinger Bands calculated on the RSI itself: volatility bands around a market base line, commonly on a 34-period basis.
The design intent is a single window that answers three questions at once: the RSI supplies momentum direction, the two moving averages supply crossover timing, and the bands supply a volatility envelope for the momentum reading. It became popular in forex trading as an all-in-one panel, though every component is a smoothed derivative of the same RSI series, so its lines confirm one another more than they independently verify anything.
The classic release carried some distinctive conventions that ports mostly preserve. The bands are usually drawn at 1.6185 standard deviations rather than the Bollinger default of 2, a golden-ratio-flavored choice from the original that has no demonstrated statistical edge, and the community grew a vocabulary around the shapes: lines braided flat around 50 read as a dead range, the price line riding an expanding band marks a strong push, and the sharp poke outside a band that immediately folds back, the shark fin, is read as an exhaustion spike. The grammar is genuinely convenient; it is also all one RSI stream wearing four costumes.
Modern Library versions extend the panel rather than the math: LazyBear's early port established the baseline, and later builds like thienlovv's and ZyadaCharts' add automated divergence detection and packaged buy/sell arrows on top of the classic lines. The honest framing for all of them is that the TDI is a well-organized RSI dashboard: it makes the state of one oscillator unusually readable, which has real workflow value, while structure, levels and volume still have to come from somewhere else.
How to identify the TDI's components
Five plots, one source. Identifying the TDI means tracing each line back to the RSI it decorates.
- 1Start at the base: a 13-period RSI computed on price; every other element derives from this series.
- 2The price line: a very fast moving average of the RSI, classically 2 periods, supplying the twitchy lead trace.
- 3The signal line: a slower average, classically 7 periods, giving the crossover partner.
- 4The base line and bands: a 34-period average of the RSI flanked by bands near 1.6185 standard deviations, framing the momentum stream's own volatility.
- 5Read the state machine: crossovers time entries, the 50 region splits bull from bear regime, band pinches mark contraction and band rides mark strong trends.
How it's calculated
TDI plots an RSI together with its own smoothed signal lines and volatility bands so momentum, trend, and volatility read from one panel.
Defaults are Dean Malone's original settings: RSI 13, price line 2, signal line 7, bands 34 with multiplier 1.6185.
Typical readings use price line versus signal line crosses for entries, both lines versus the base line for trend, and band width for volatility.
Some platforms offer EMA smoothing options or a population standard deviation, which slightly changes band width.
How traders use it
- As a crossover trigger: the fast price line crossing the slower signal line is the classic TDI entry cue, usually filtered by whether both sit above or below the 50 midline.
- As a volatility read: the price line pressing an outer band marks stretched momentum, while pinching bands signal contraction that often precedes a stronger directional move (not a guaranteed one).
- As a regime filter: the market base line's position and slope relative to 50 is used to permit longs, shorts, or neither, functioning like a bias check before any crossover is taken.
- As a divergence panel: because the price line is a lightly smoothed RSI, classic and hidden divergences against price are read directly off the TDI, and several ports annotate them automatically.
- With zone grammar: excursions into the outer RSI zones, commonly 68 and 32 on the TDI scale, add an overbought/oversold layer, most useful when a zone touch coincides with a shark-fin poke outside the band.
TDI vs related momentum tools
RSI: The TDI is RSI with staging: smoothed copies, a slow baseline and a volatility envelope, all computed on the oscillator itself. Nothing in the dressing adds independent information; what it adds is readability, turning RSI's single squiggle into an organized state display.
Stochastic RSI: Both are RSI derivatives with opposite temperaments: Stochastic RSI stretches the oscillator to amplify sensitivity, accepting noise, while the TDI smooths and frames it to emphasize regime and timing, accepting lag. One turns the volume up, the other tidies the room.
MACD: MACD builds its crossover grammar from price-based averages; the TDI builds an equivalent grammar from RSI-based ones. The reads rhyme, fast-slow crosses and centerline regime, but MACD is unbounded and price-anchored while the TDI inherits RSI's 0-100 cage and its saturation behavior.
Concept family
Momentum & Oscillators
91 concepts mapped · 91 in the Library
Traders Dynamic Index FAQ
Turn Traders Dynamic Index into a trading strategy.
Take the implementation from this page into Quant, then build on it, backtest it on real data, and keep refining it in conversation.