Up/down Volume Ratio
 By LuxAlgoFeb 27, 2026
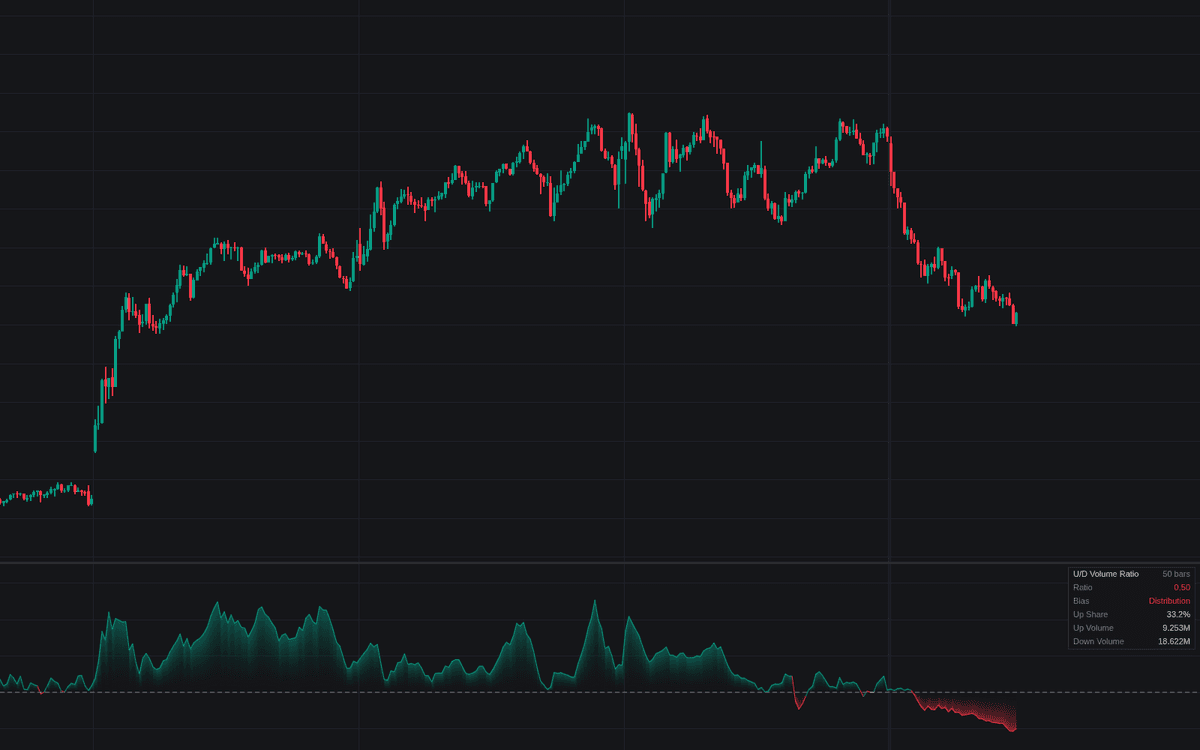

Up/down Volume Ratio sums the volume traded on advancing bars, divides it by the volume traded on declining bars, and reads the result against a dashed 1.0 balance level: above it, participation has favored the up side. It covers both traditions of the up/down volume ratio: the classic 50-bar rolling screen of the growth-stock lineage and a session-totals intraday variant, with a coarse bar-direction split or a finer intrabar tick split.
How to Trade the Up/down Volume Ratio?
- Ratio above 1.0: accumulated volume favors advancing bars, net accumulation; below 1.0, net distribution. Balance crossings fire the shift alerts.
- Level plus trend: the optional Ratio Trend line adds direction. Above 1.0 and rising is the classic accumulation signature, while a ratio deteriorating as price pushes higher flags advances on thinning participation.
Up/down Volume Ratio Settings
- Accumulation Window (default Rolling Window): sum the last N bars, or Session Totals since the trading day began.
- Window Length (default 50): bars summed in rolling mode, about ten weeks on daily charts; shorter swings harder.
- Volume Split (default Bar Direction): whole-bar assignment, or Intrabar Upticks/Downticks for the tick-rule split.
- Up/Down Basis (default Previous Close): reference labeling a bar up or down; Bar Open is the alternative.
- Unchanged Bars (default Exclude): leave flat bars out of both sides, or assign them the Prior Direction.
- Auto Intrabar Timeframe (default enabled): picks the tick-split timeframe; disable to set the Custom Intrabar Timeframe (default 1).
- Trend Line (default disabled): smooths the ratio via Trend Length (default 10) and Trend Type (default SMA).
- Show Dashboard (default enabled) and Gradient Fill (default enabled): the stats panel and the fill toward the balance line.
Frequently Asked Questions

Original indicatorBuilt in-house by LuxAlgo
The Library is free. Quant makes it yours.
Pull any concept or indicator into Quant: rebuild it, retune it, or turn it into a backtested strategy of your own.