Concept
Up/down Volume Ratio
Up/down Volume Ratio is a Volume & Order Flow concept. The Library holds 1 implementation, a working definition you can pull into Quant.
Top Up/down Volume Ratio indicator
The top custom implementation, built on the original standard Up/down Volume Ratio formula.
1 total
This Up/down Volume Ratio implementation is strategy-ready: open it in Quant, set your rules, and it backtests automatically.
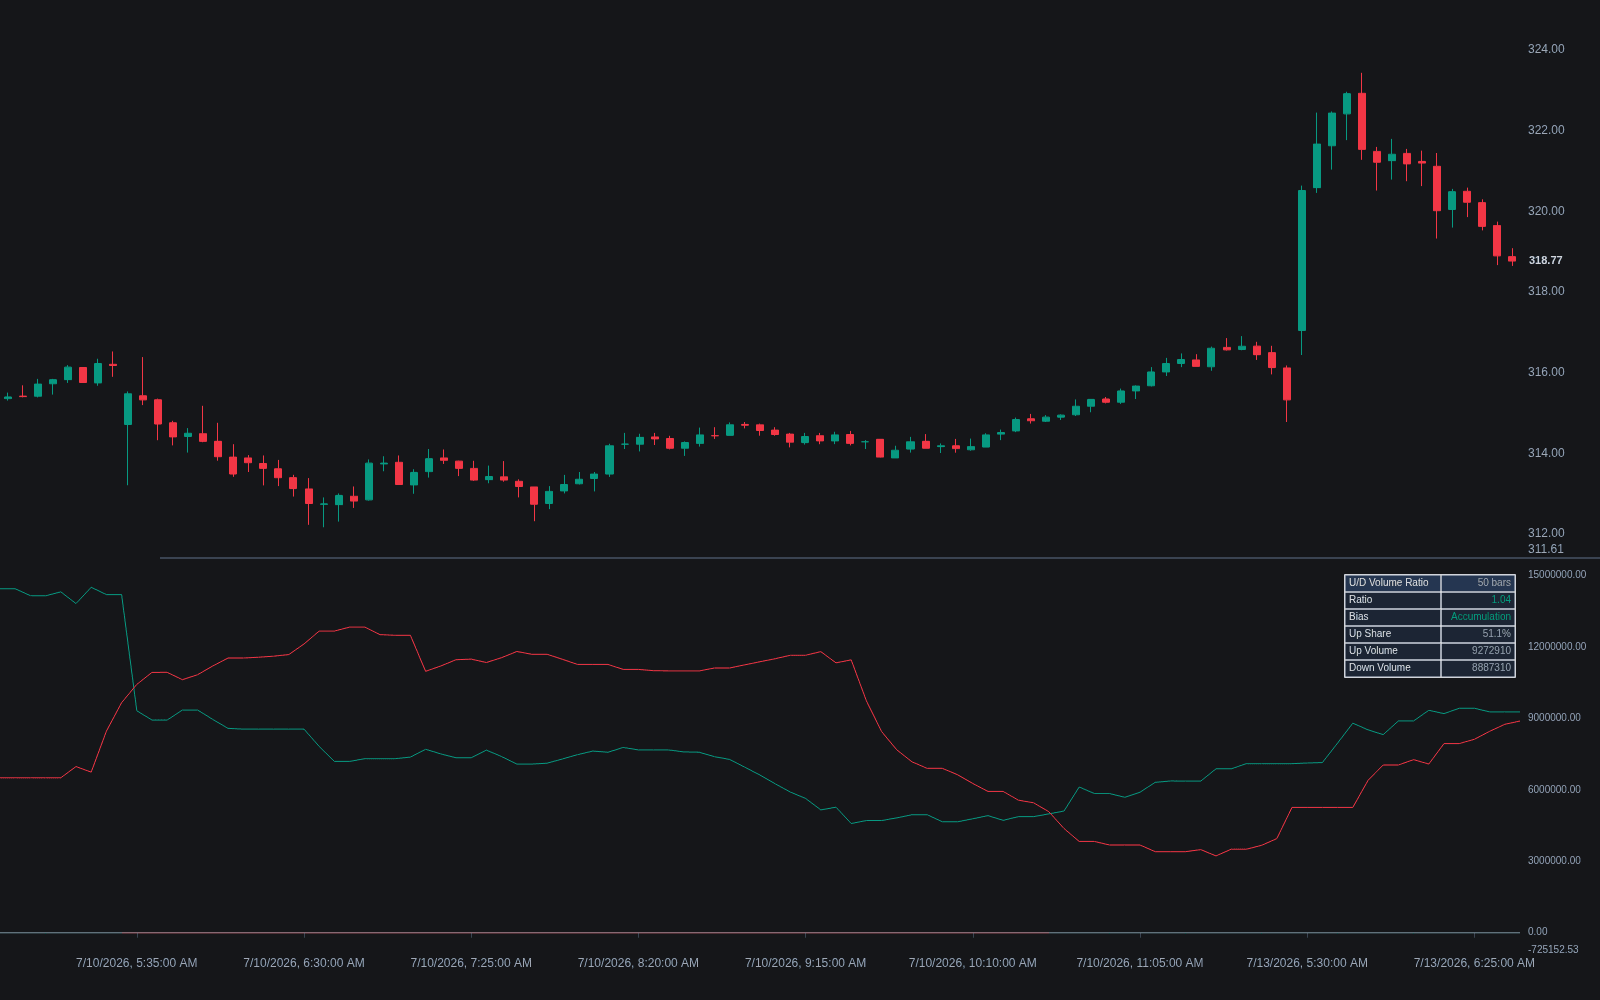
What is the Up/down Volume Ratio?
The up/down volume ratio compares volume transacted on strength against volume transacted on weakness. The best-known form comes from the growth-stock screening tradition associated with William O'Neil: sum the volume of all up days over a lookback (50 trading days in the classic construction), divide by the summed volume of all down days, and read values above 1.0 as net accumulation and values below 1.0 as net distribution.
The same name is also used intraday for a different construction: each bar's volume is split into up and down portions, by uptick versus downtick or by close direction, then expressed as a ratio or a buy/sell percentage. That version sits close to volume delta territory. Because the two constructions answer different questions on different horizons, check which one a given tool implements before reading its output.
The screening form spread through Investor's Business Daily, the newspaper O'Neil founded in 1984, where the 50-day ratio became a standard gauge of institutional demand in the CAN SLIM methodology. The idea itself is older and shared with OBV: bucket volume by price direction and let the imbalance show which side has been paying up. The ratio packages that logic as a single number over a fixed window rather than a running cumulative line.
The construction is deliberately coarse: a session that closes higher by a cent contributes its entire volume to the up bucket, so one earnings gap or rebalancing day can swing the reading for weeks. Practitioners therefore read the ratio alongside relative volume, which says whether turnover is unusual at all, and price structure, which says where the supposed accumulation happened. A ratio above 1.0 at all-time highs after a long advance is a very different statement from the same number inside a quiet base.
How to calculate the up/down volume ratio
The classic screening construction needs only daily closes and volume.
- 1Choose a lookback, 50 trading days in the standard form.
- 2Label each day in the window as up or down by comparing its close with the prior close; unchanged days are typically excluded.
- 3Sum the volume of all up days, sum the volume of all down days, and divide the first by the second.
- 4Read the result around 1.0: above it, volume has favored advancing days; below it, declining days. Track the trend as well as the level.
- 5For the intraday variant, split each bar's volume into buying and selling portions by tick or close direction and ratio the running session totals instead.
How it's calculated
The up/down volume ratio compares total volume traded on rising bars to total volume traded on falling bars over a lookback window.
Popularized by Investor's Business Daily on daily bars with n = 50; readings above roughly 1.0 point to accumulation, below 1.0 to distribution.
Bars with an unchanged close drop out of both sums, and a window with zero down volume leaves the ratio undefined, so implementations cap it.
A common variant normalizes to UpVol / (UpVol + DownVol), which runs 0 to 1 (or 0 to 100 as a percent).
How traders use it
- For screening: position traders shortlist stocks whose ratio sits above 1.0 and is improving, treating persistent heavy up-day volume as evidence of accumulation while a base forms.
- For base and breakout quality: a ratio that strengthens as a base develops is constructive, while repeated heavy down-day volume inside a base is a red flag for the eventual breakout.
- Intraday: the buy/sell split version serves as a session bias gauge, read alongside delta, session VWAP, and price structure rather than in isolation.
- As breakout confirmation: pairing the ratio with volume at breakout checks both the preparation and the move itself; a pivot cleared on a volume spike is more credible when the base behind it accumulated well.
- As a divergence check: price pushing to new highs while the ratio deteriorates means up days on thinning participation, the warning that volume divergence tools express bar by bar.
- For locating the activity: Volume Profile shows the prices where the heavy transacting occurred, a price-based complement to the ratio's time-based summary.
Up/down volume ratio vs related volume tools
OBV: OBV adds or subtracts each day's full volume by close direction and plots the running total, read through slope and divergences rather than level. The up/down ratio applies the same bucketing over a fixed window and reports one screenable number.
Volume Delta: Delta classifies each trade by whether it hit the bid or lifted the offer, measuring aggressor flow within the bar. The classic ratio buckets entire days by close direction, a far coarser but far more widely available approximation.
Money Flow Index: MFI multiplies typical price by volume, splits flows by the direction of typical price, and normalizes to a 0 to 100 oscillator: a bounded momentum reading, where the up/down ratio is an unbounded accumulation gauge centered on 1.0.
Relative Volume: Relative volume measures how much is trading versus what is typical, saying nothing about direction. The up/down ratio measures the direction of volume, saying nothing about whether turnover is unusual. The two answer complementary questions.
Concept family
Volume & Order Flow
88 concepts mapped · 88 in the Library
Up/down Volume Ratio FAQ
Turn Up/down Volume Ratio into a trading strategy.
Take the implementation from this page into Quant, then build on it, backtest it on real data, and keep refining it in conversation.